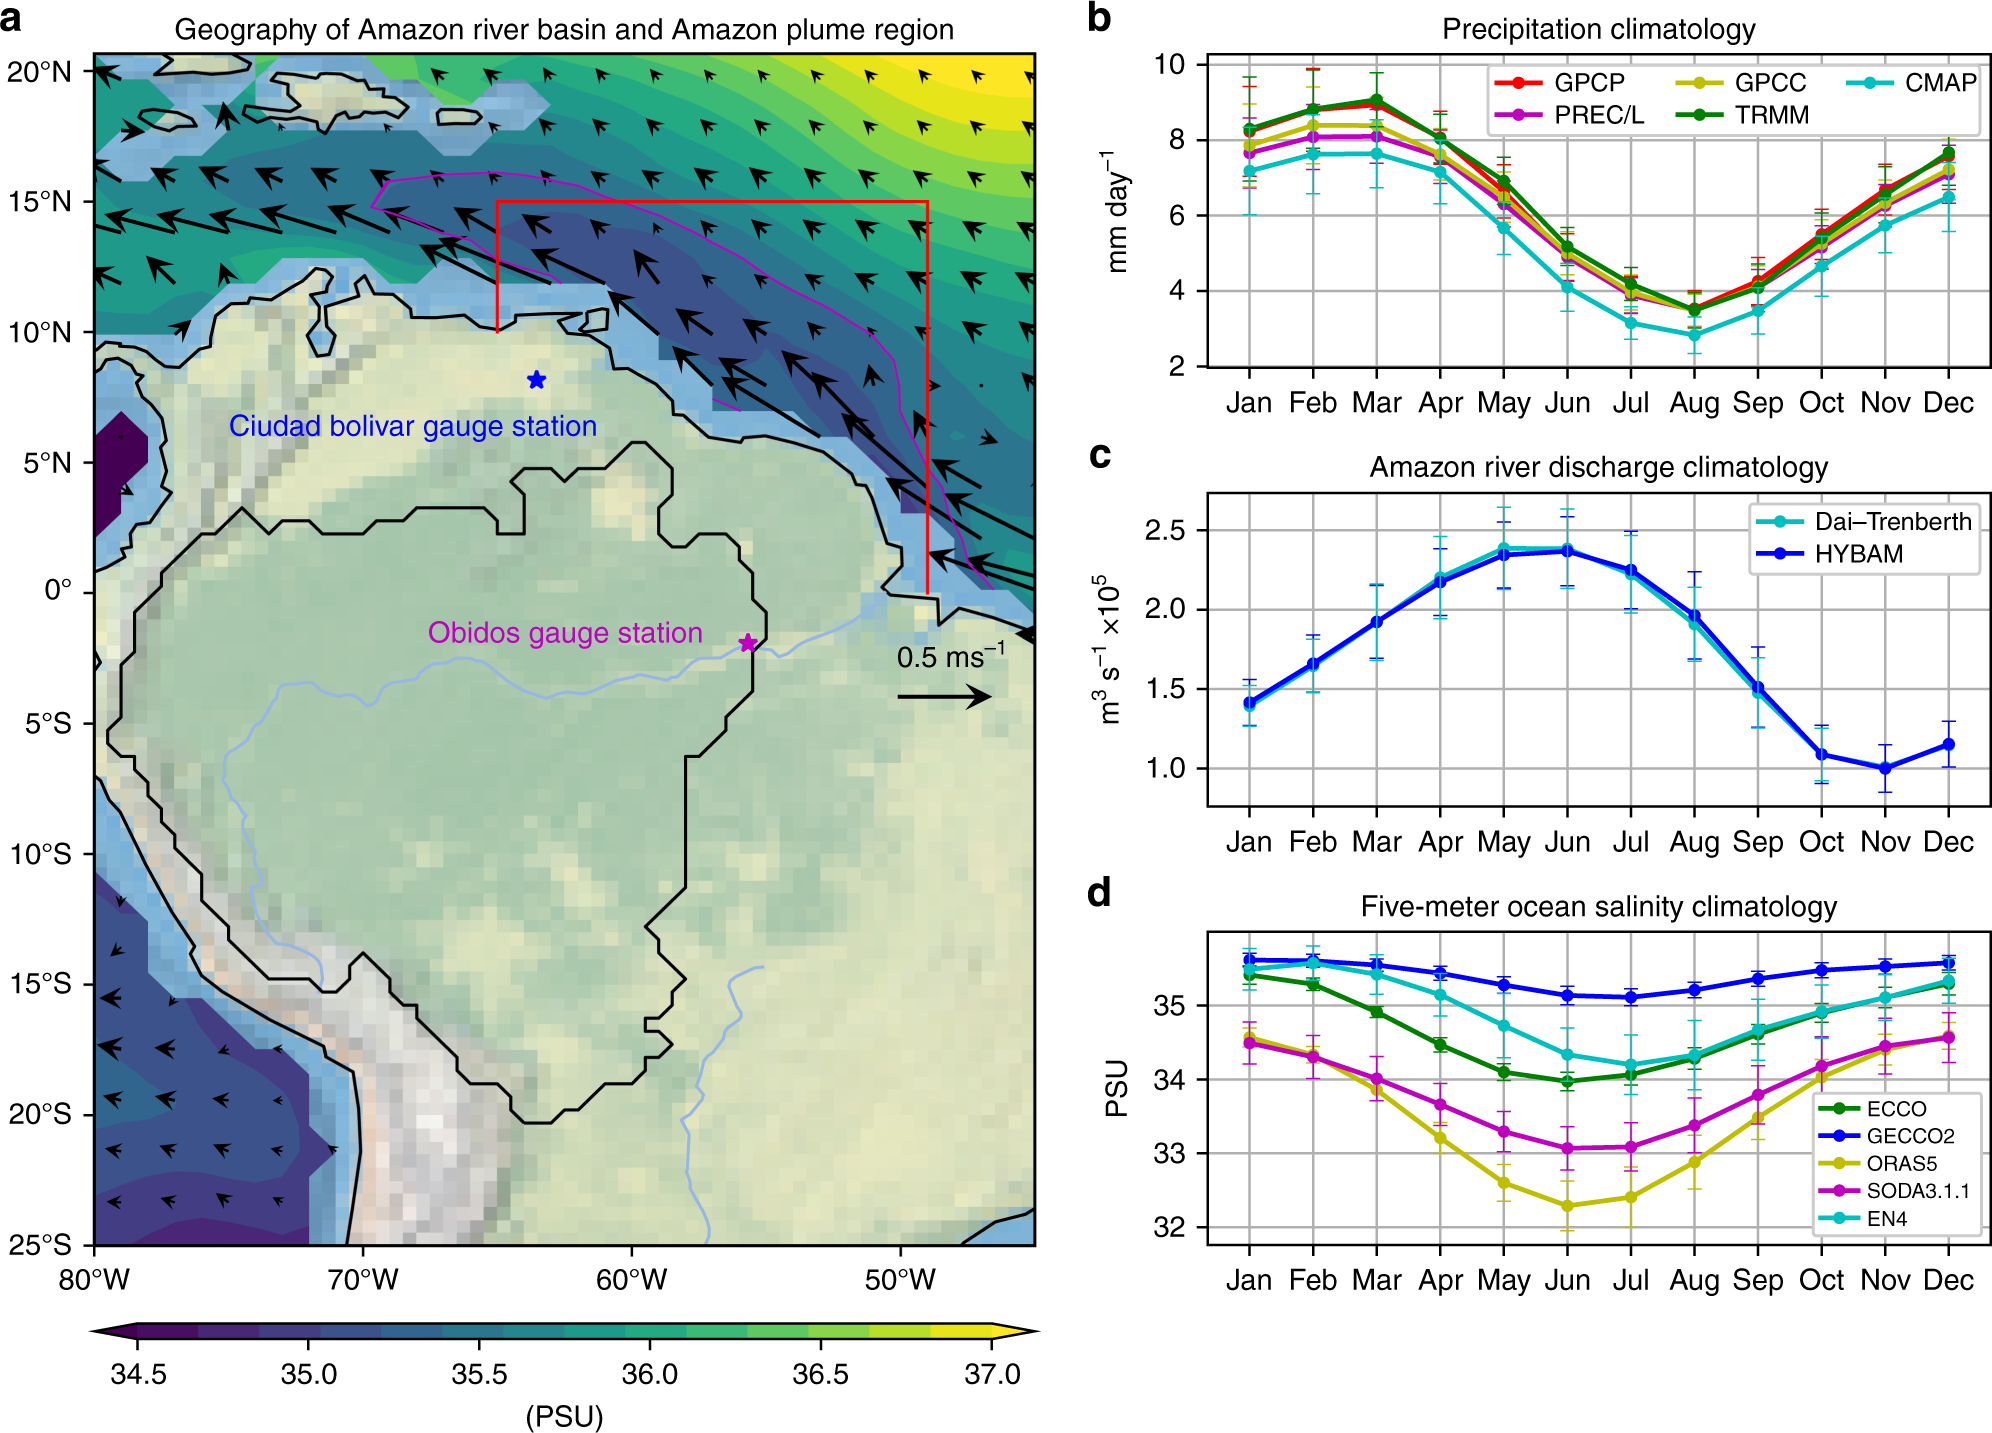
Fig. 1: Relationships between the seasonal cycles in Amazonia precipitation, Amazon river discharge, and Amazon plume region (APR) ocean salinity.
From: Amplified seasonal cycle in hydroclimate over the Amazon river basin and its plume region

a The geographic ___domain of Amazon river basin (black contour line) and APR (red box). The color shading over the ocean represents annual mean 5-m ocean salinity with 34.5 PSU countered as magenta, and the black arrows denote annual mean 5-m ocean current velocities. The magenta and blue stars denote the ___location of the Obidos and Ciudad Bolivar gauge stations, where Amazon and Orinoco river discharges were recorded, respectively. b Long-term mean (1979–2018) of observed precipitation averaged over the Amazon river basin in each month. Note that the mean TRMM precipitation is averaged over 1998–2018. c Long-term mean of Amazon river discharge (1979–2018) at Obidos and Dai and Trenberth river discharge (1979–2014) in each month. d Long-term mean of 5-m ECCO4 (1992–2017), GECCO2 (1979–2016), ORAS5 (1979–2018), SODA3.3.1 (1980–2015), and EN4 (1979–2018) ocean salinity averaged over the APR in each month. The error bars in b, c, and d indicate the standard deviations of each month throughout the analysis period. The geographic map is produced by Python Cartopy package77.
