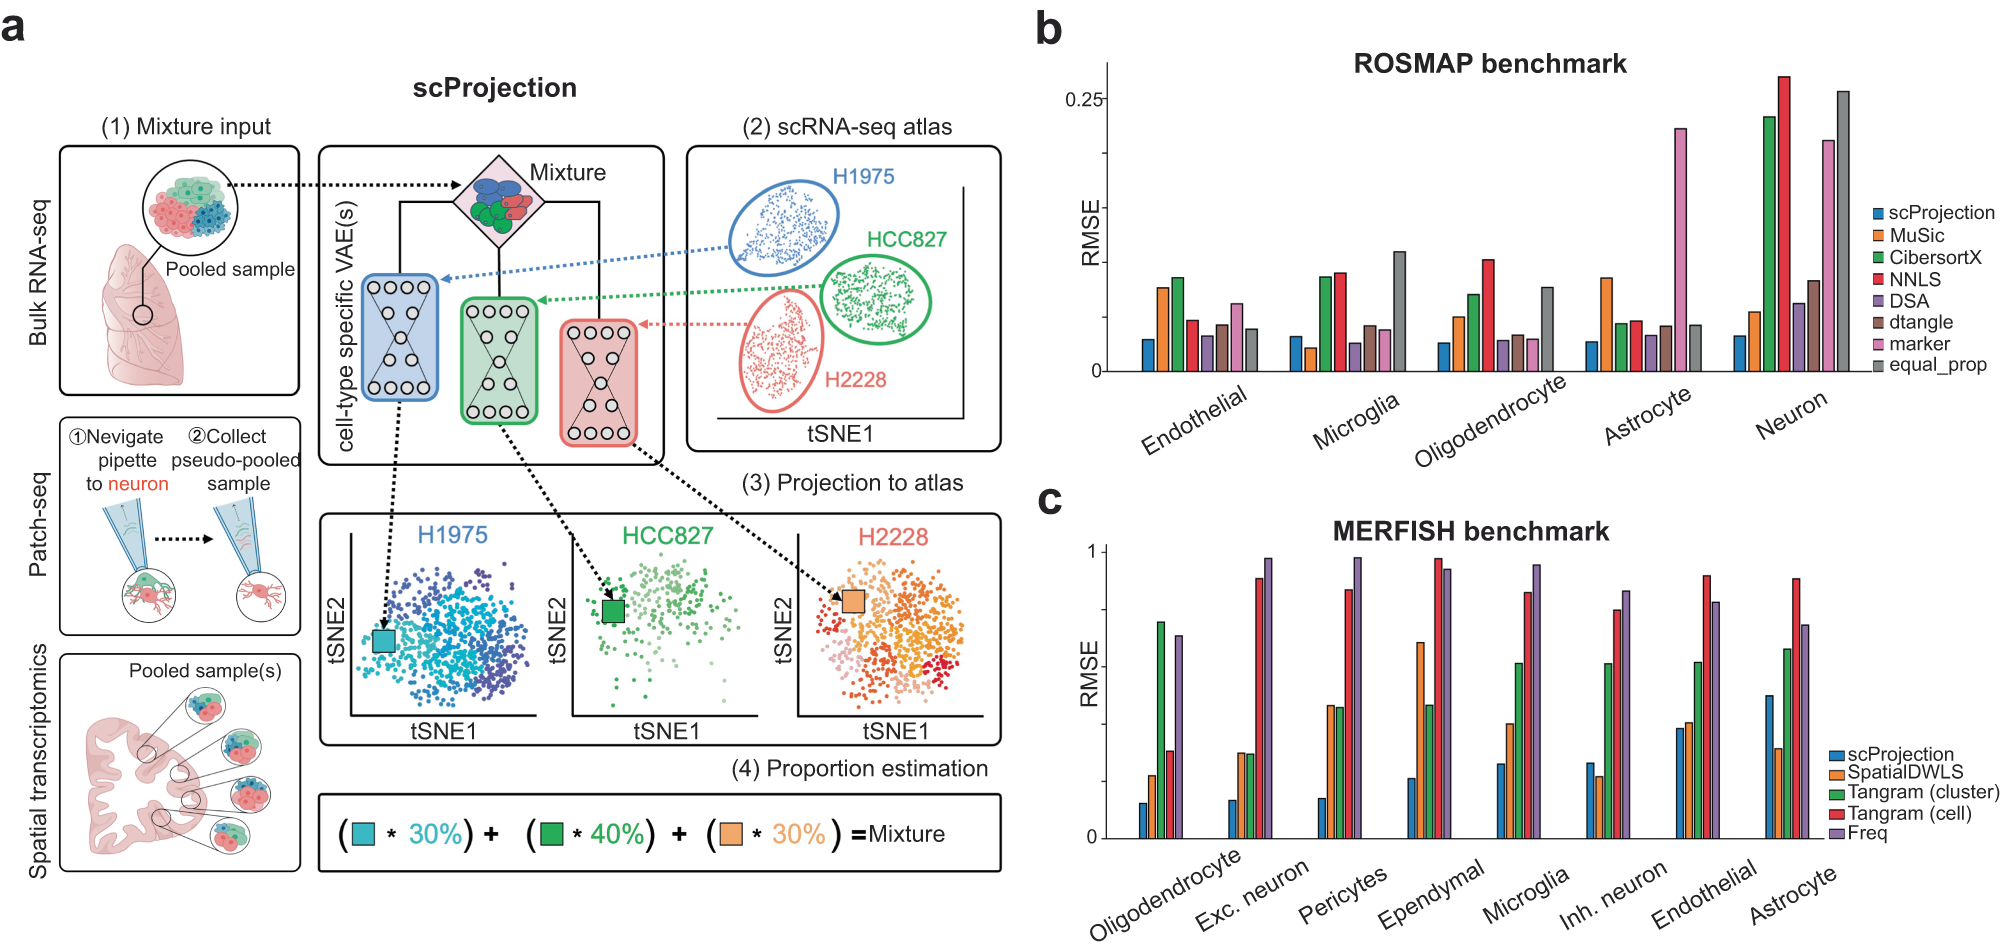
Fig. 1: RNA projection and cell type abundance estimation with scProjection.

a (1) The primary input to scProjection consists of one or more RNA measurements originating from mixtures of cells assayed using bulk RNA-seq, multi-modal assays or spatial transcriptomics. (2) The secondary input to scProjection is a single-cell atlas from the same region or tissue as the mixture samples and contains the same cell types present in the mixture samples. For each of the annotated cell types in the single-cell atlas, a variational autoencoder is trained to capture within-cell type variation in expression. (3, 4) scProjection uses the variational autoencoder to extract cell type-specific contributions to each mixed sample, as well as the % RNA contribution of each of those cell types to the mixture. b Bar plots indicate the root-mean-square error (RMSE) in predicted cell type abundances for each deconvolution method on the ROSMAP (Patrick et al. 2020) benchmark data; grey bars represent the error of a baseline approach (equal_prop) of predicting equal RNA contributions from each cell type. c Bar plots indicate the RMSE in the estimated cell type proportion for each deconvolution method on the spatial transcriptome-based benchmarking data (Moffitt et al. 2018). Purple bars (Freq) represent the error of a baseline approach of predicting proportion based on the frequency of each cell type in the MERFISH RNA measurements, based on the original authors’ labels.
