
Fig. 5: DeepLiver enhancer architecture on a periportal enhancer.
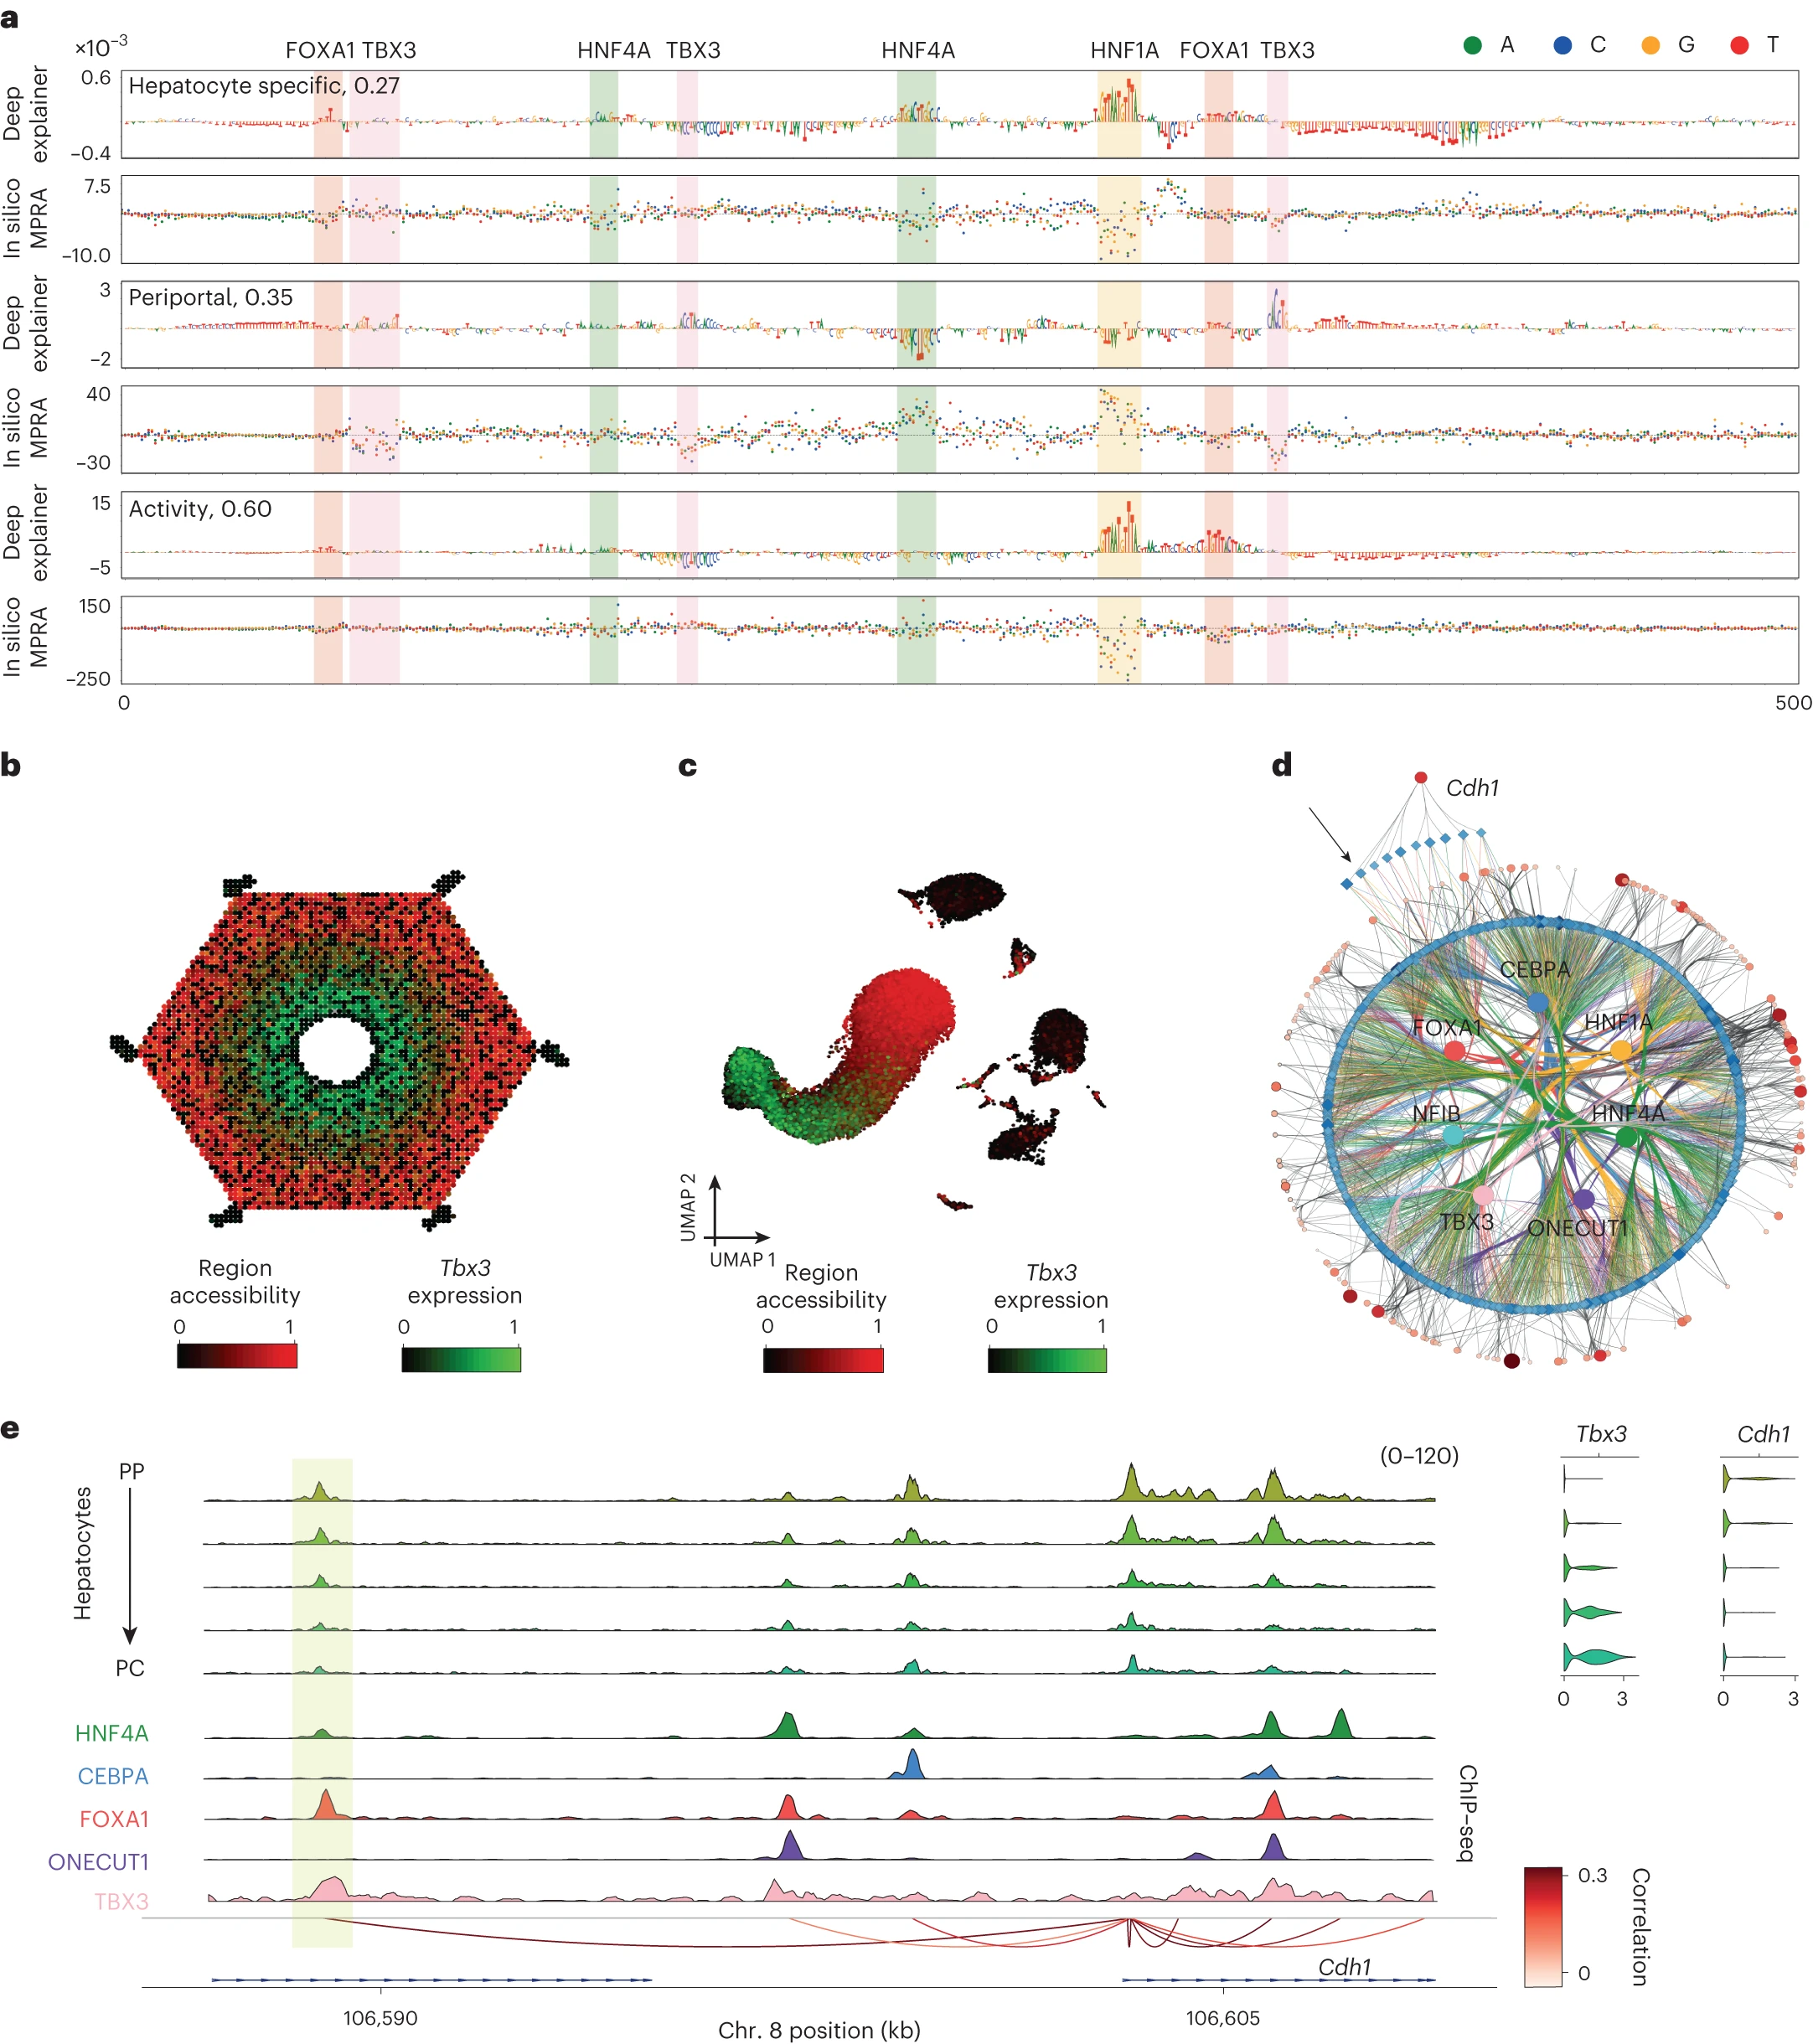
a, DeepExplainer and saturation mutagenesis plots for the accessibility, zonation and activity models on a Cdh1 periportal enhancer (chromosome 8: 106588720–106589220), with motifs highlighted. The accessibility model highlights the nucleotides that make the enhancer accessible in hepatocytes (versus other cell types in the liver); the zonation model highlights the nucleotides that contribute to making the enhancer periportal; and the activity model highlights the nucleotides that have a role in its activity. b, ScoMAP liver lobule template (4,498 cells) coloured by region accessibility and TBX3 expression. c, Transcriptome-based UMAPs (29,798 cells) coloured by region accessibility and TBX3 expression. d, Periportal core hepatocyte eGRN, with 175 periportal marker genes and 972 regions targeted by the selected core TFs (with CRM score > 3) and conserved across mice. The Cdh1 enhancer region is indicated by an arrow. e, Coverage plot showing pseudobulk accessibility profiles, ChIP–seq coverage (for HNF4A, CEBPA, FOXA1, ONECUT1 and TBX3), SCENIC+ region-to-gene links coloured by correlation score, and Cdh1 and Tbx3 expression across the zonated hepatocyte classes (from periportal to pericentral). The Cdh1 enhancer region is highlighted in yellow. For the transcriptome and epigenome data, cells from five and four biological replicates were combined, respectively. Source numerical data are provided as source data.
