
Fig. 8: Validation of zonated repressor TFs through FACS–MPRA, cross-species analysis and luciferase assays.
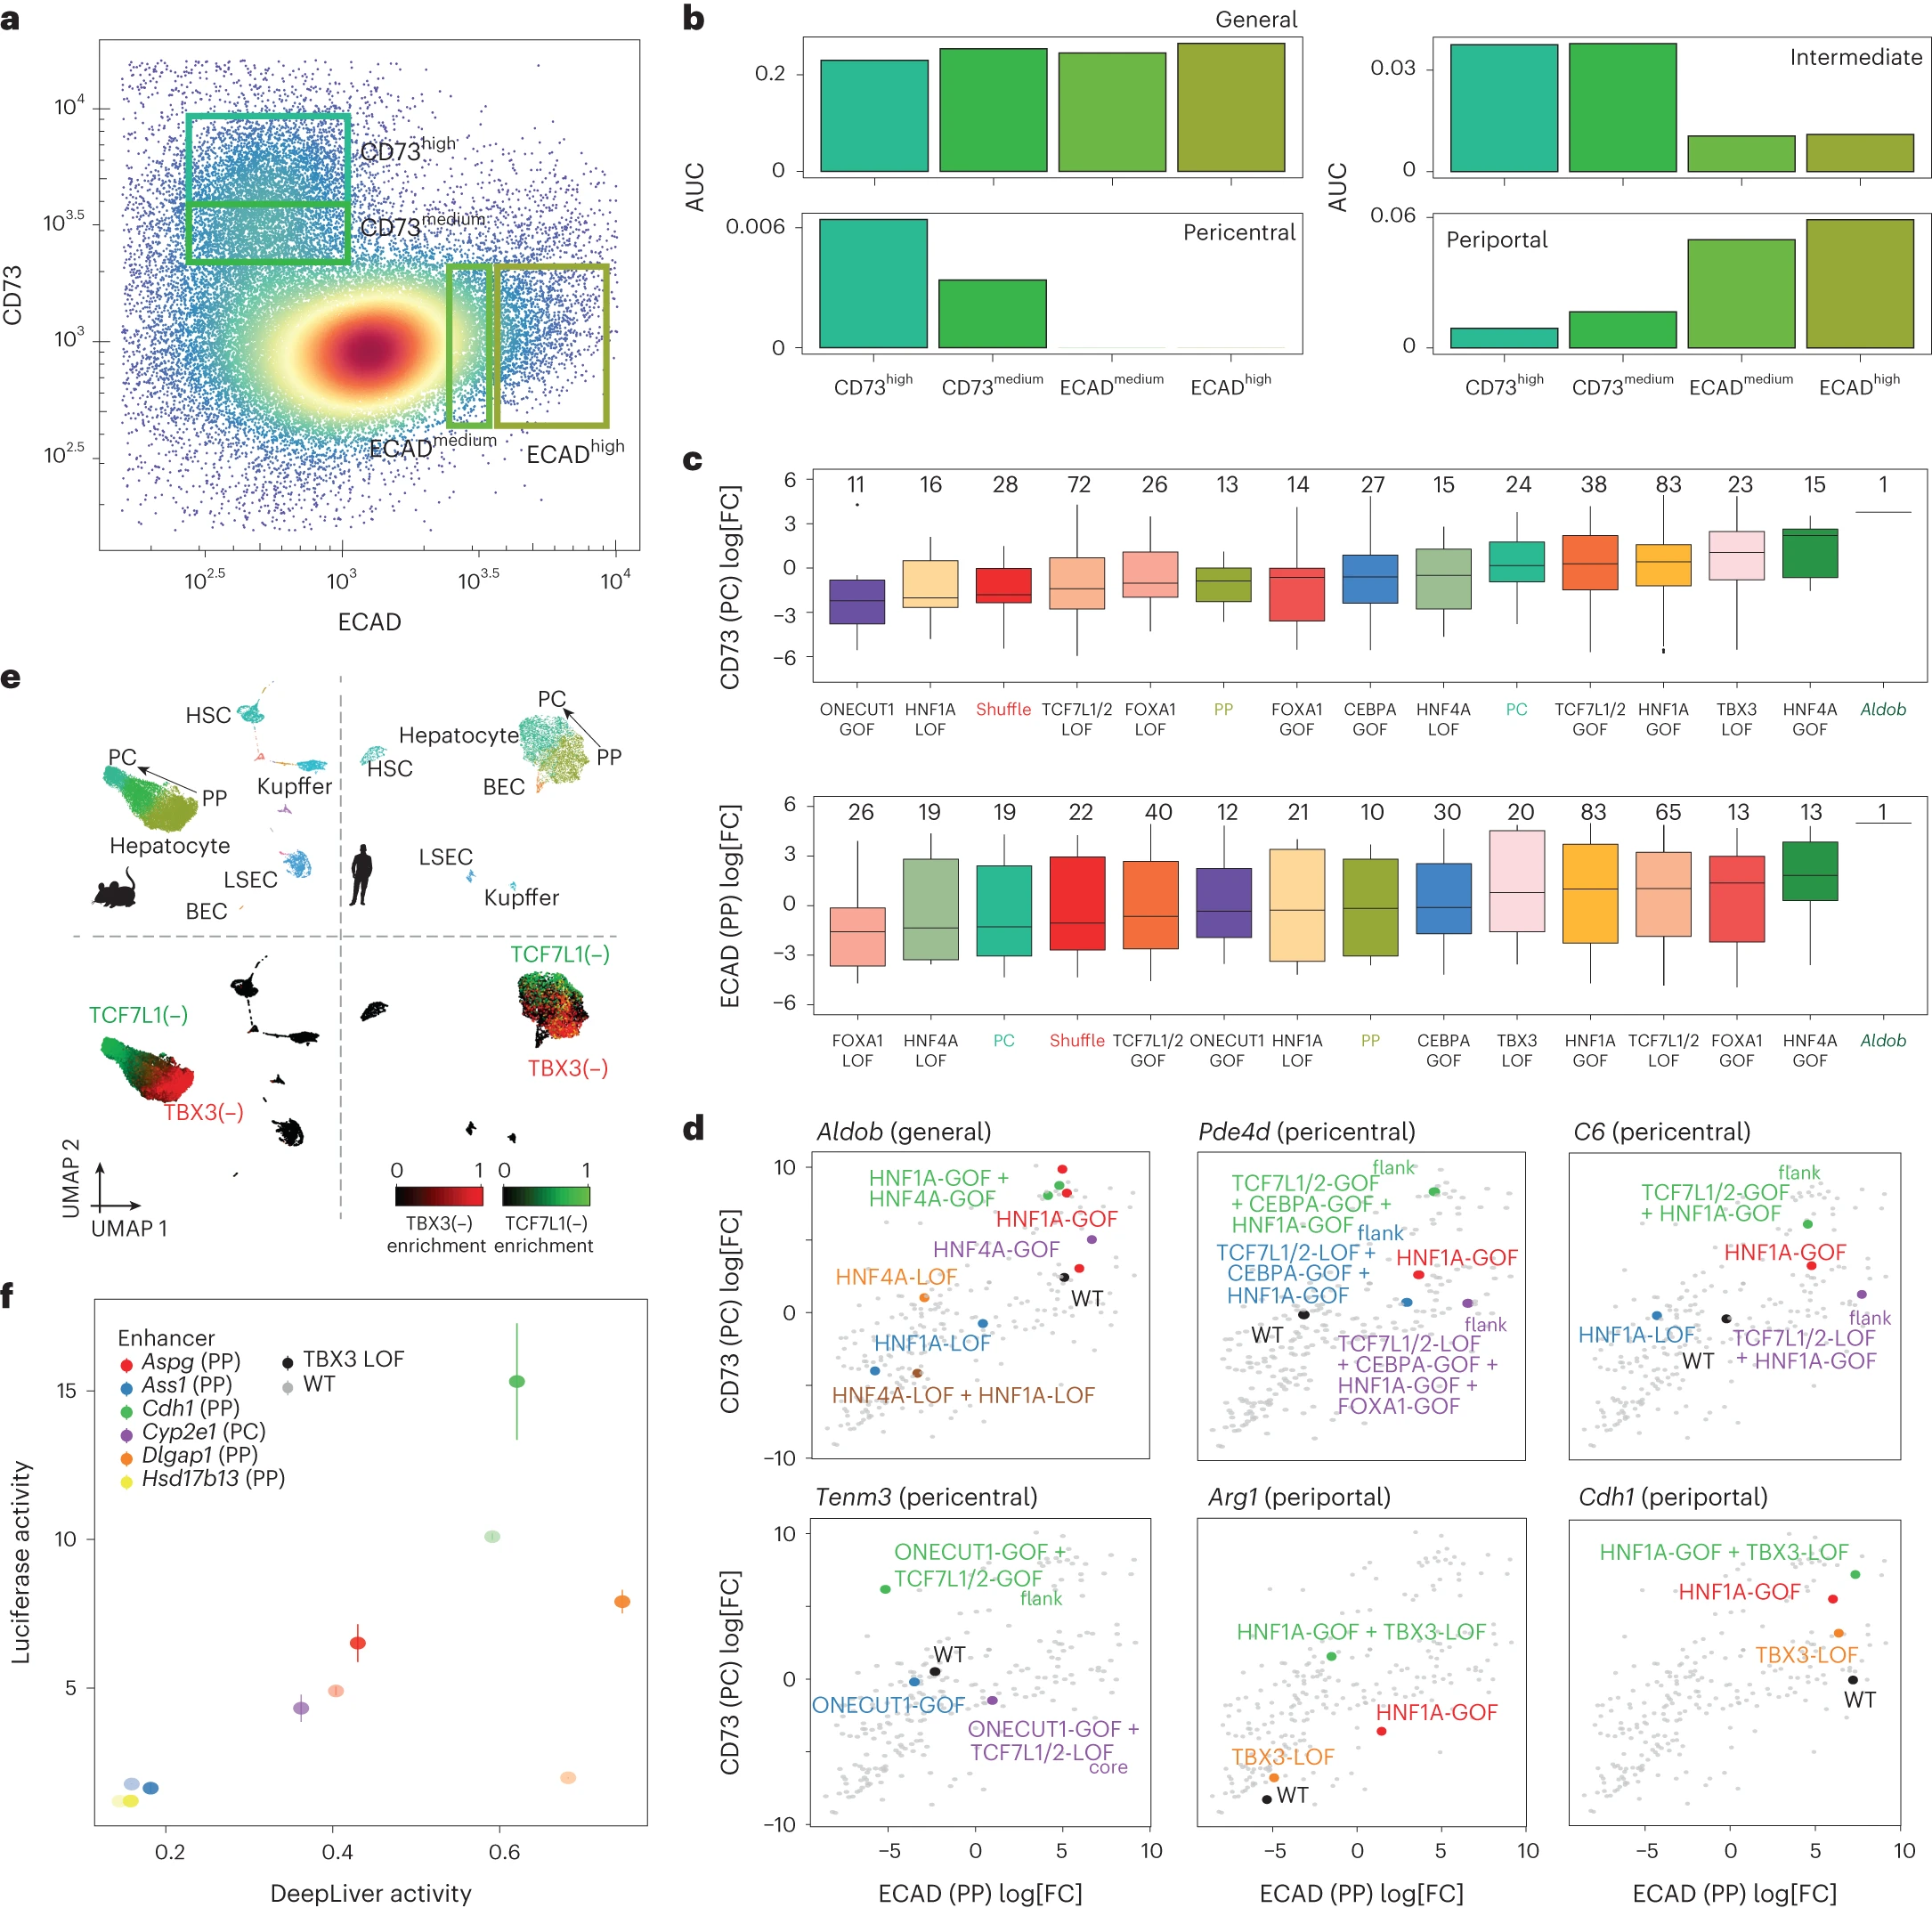
a, FACS analysis of the selected cells according to the intensities of CD73 and ECAD. The rectangles indicate the selected bins along the portocentral axis. b, AUCell enrichment of the core general, pericentral, pericentral-intermediate and periportal regions on the sorted populations. c, In vivo MPRA log2[FC] values for the aggregated CD73 and ECAD populations per variant class. The number of enhancers in each group is indicated at the top. The activity of the Aldob enhancer is indicated by a line. The centre line shows the median value, the top and bottom hinges represent the upper and lower quartiles, and the whiskers extend from the hinge to the largest and smallest value no further than 1.5 × interquartile range from the hinge, respectively. Control and wild-type sequences are highlighted. Four biological replicates were used. d, CD73 MPRA log2[FC] versus ECAD MPRA log2[FC] values with the highlighted sequence variants for each enhancer. Four biological replicates were used. e, Mouse and human liver snATAC–seq UMAP (22,600 and 6,366 cells, respectively) coloured by cell type (top) and eRegulon enrichment (bottom). For the mouse UMAP, cells from four biological replicates were combined. f, Luciferase activity in HepG2 cells versus DeepLiver activity scores for selected enhancers and their variants. n = 4 biologically independent luciferase experiments per enhancer. Data are mean ± s.e.m. WT, wild type. Source numerical data are provided as source data.
