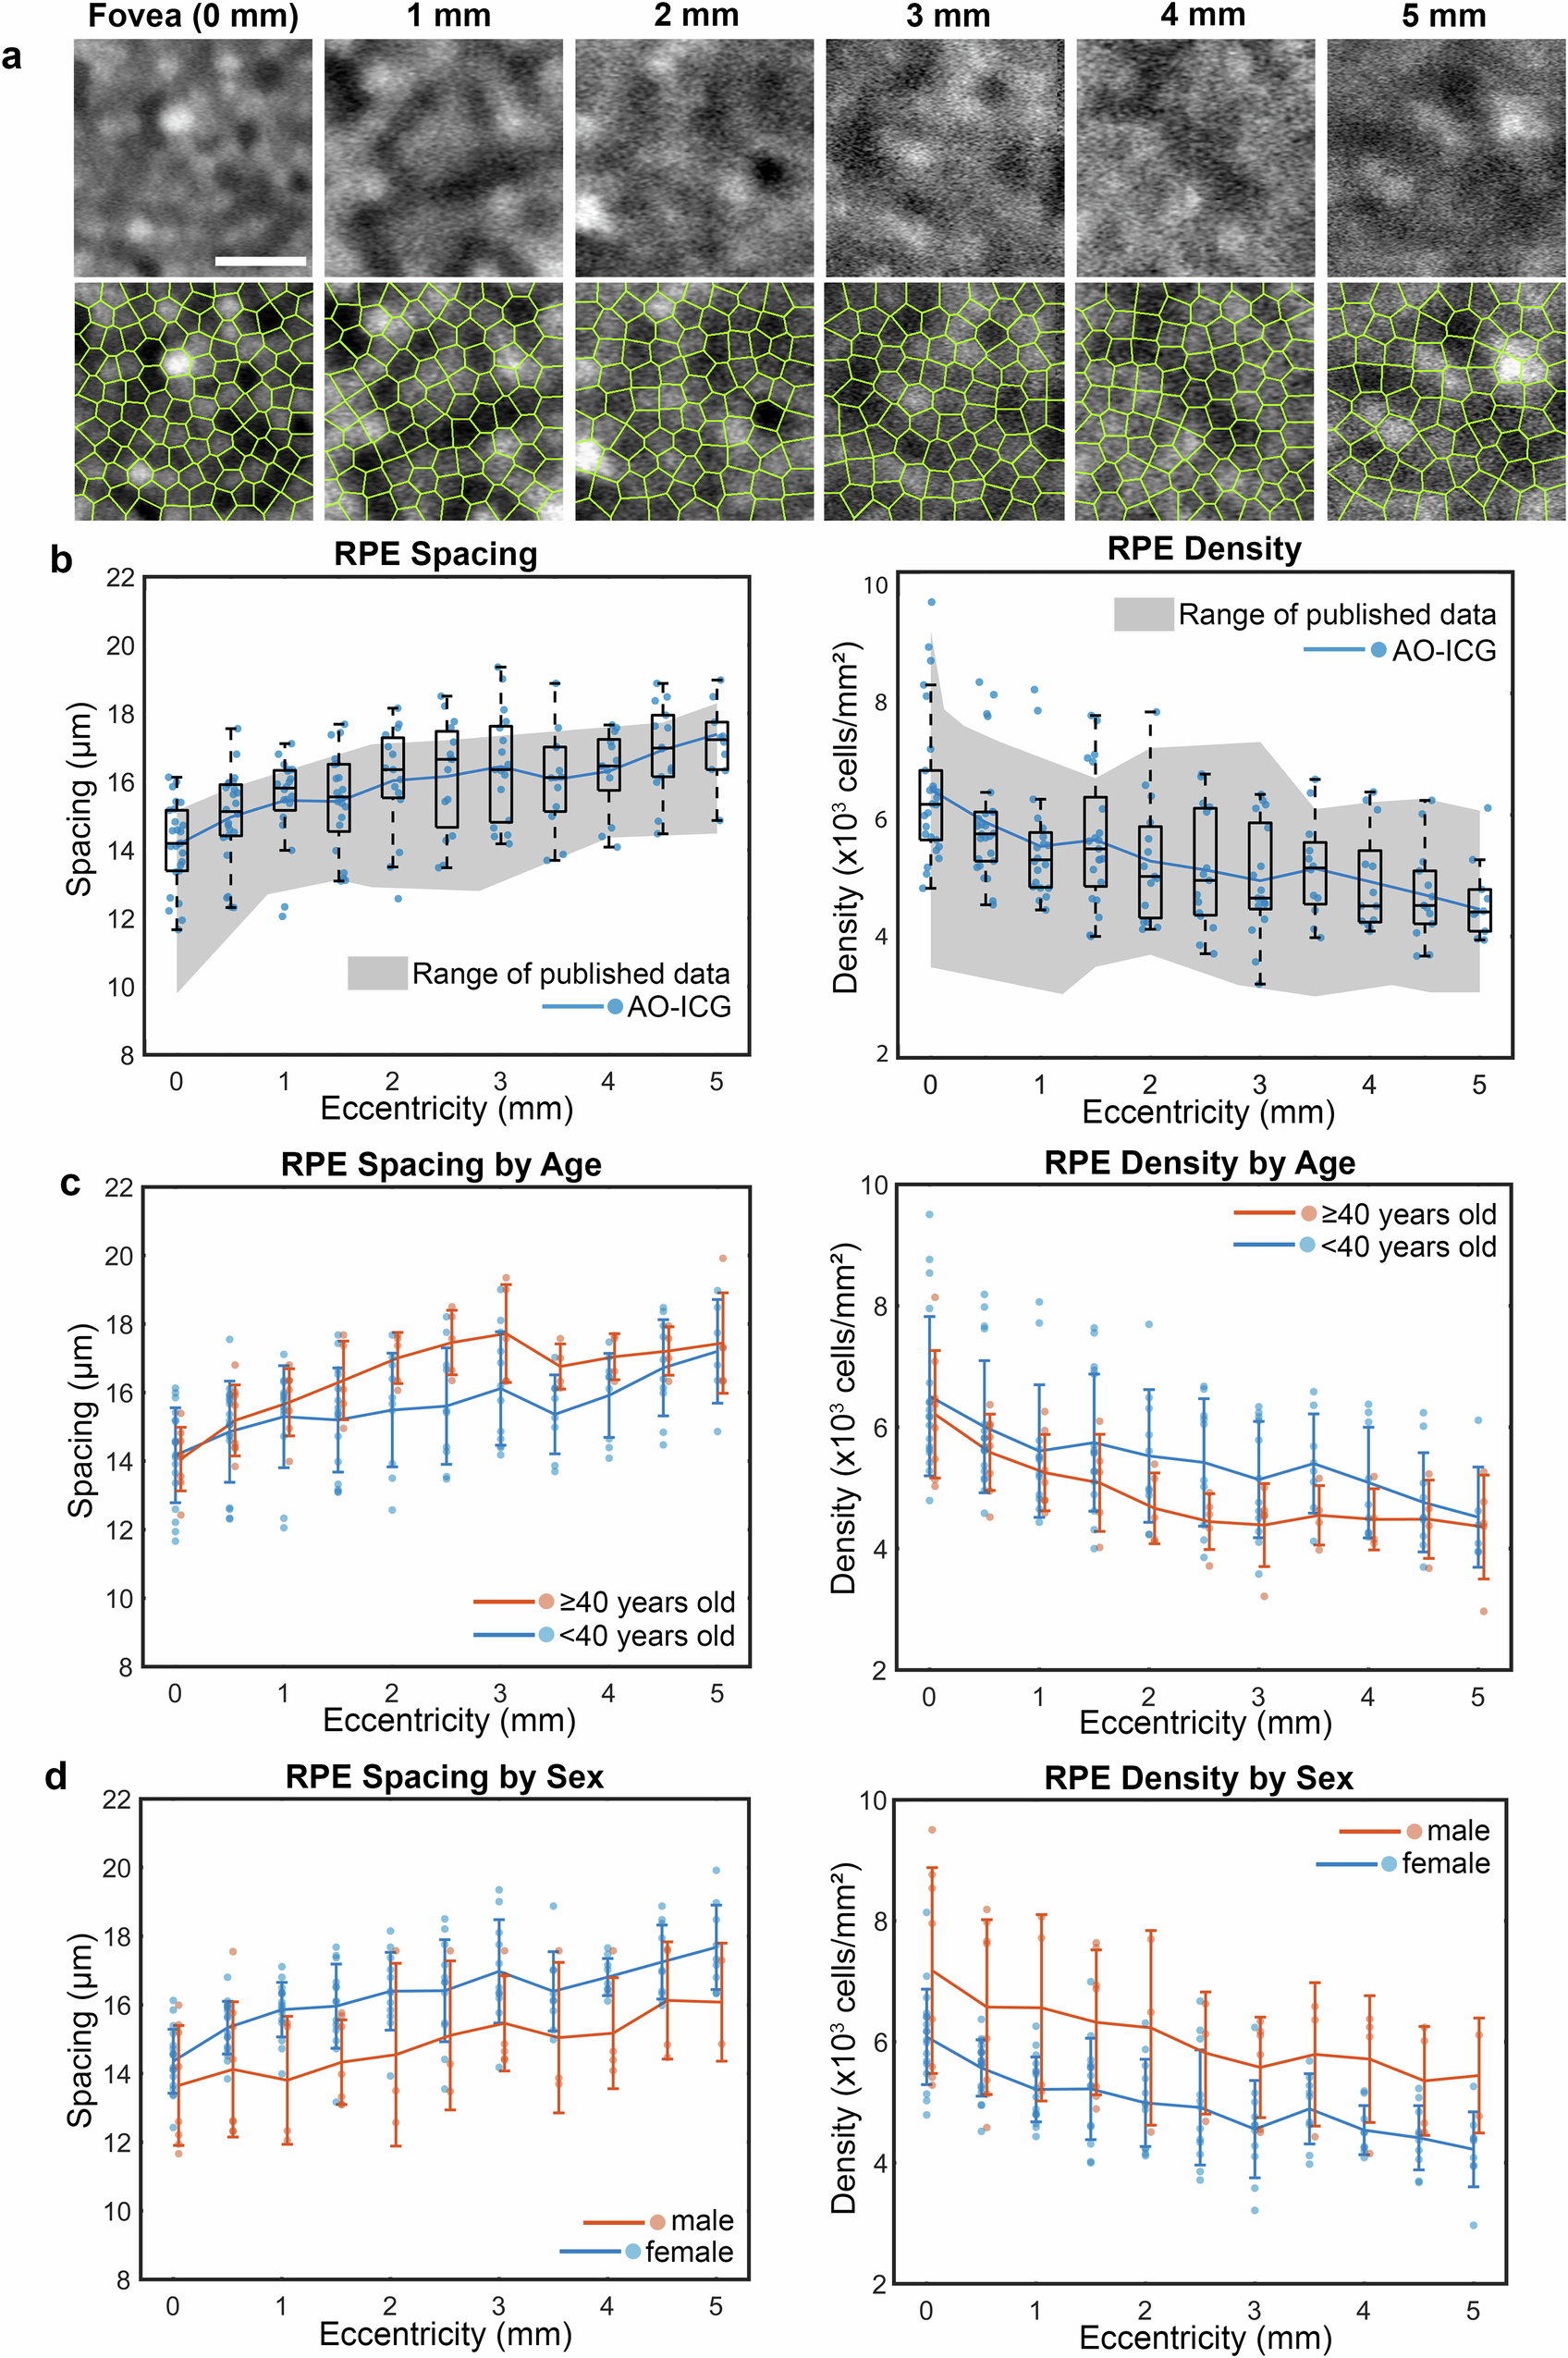
Fig. 1: Late phase adaptive optics enhanced indocyanine green (AO-ICG) imaging enables measurement of retinal pigment epithelial (RPE) cell-to-cell spacing and density across the temporal eccentricities and age-related changes.

a Example AO-ICG RPE mosaic at different eccentricities (top row) showing each RPE cell uniformly labeled by ICG. The corresponding Voronoi maps of the RPE cells (bottom row) are shown for visualization purposes. b RPE spacing and density measurements using AO-ICG images compared to previously published in vivo and ex vivo data (gray shaded area: range of previously reported values). Box plot: center line: median, box limits: upper/lower quartiles, whiskers: 1.5x interquartile range; blue markers: individual data points calculated from each ___location in each eye (n = 190 locations in this plot); blue line: averaged measurements across all eyes based on AO-ICG. c RPE spacing and density comparison between <40 (n = 130 locations) and ≥40 (n = 60 locations) years old. In general, RPE spacing is larger in ≥40-year-old cohort at most eccentricities in this study. RPE density is smaller at most eccentricities in the ≥40-year-old cohort. Line: mean ± SD; markers: individual data points. d RPE spacing and density comparison between male (n = 52 locations) and female (n = 138 locations). At all eccentricities, females have higher RPE spacing and lower density. Line: mean ± SD; markers: individual data points. Scale bar: 50 µm.
