
Table 1 Structure-activity relationships of monomeric dCym derivatives and Homo-BacPROTACs 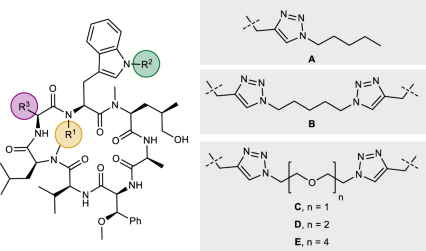

From: Homo-BacPROTAC-induced degradation of ClpC1 as a strategy against drug-resistant mycobacteria
Entry | Compound | R1 | R2 | R3 | ClpC1-NTD KD[a] [nM] Mean ± SD | MIC Mtb H37Rv[b] [µM] Mean ± SD | Influence of N-methylation on permeability[c] | |
|---|---|---|---|---|---|---|---|---|
1 | dCymC | Monomer | H |
|
| 1.1 ± 0.4 | 0.4 ± 0.1 | 1.6 |
23 | Me | 12.1 ± 0.3 | n.d. | |||||
2 | 10 | Monomer | H | Me |
| 4.0 ± 0.7 | 3.1 ± 0.0 | >11.8 |
20 | Me | 13.9 ± 0.3 | 50.0 ± 0.0 | |||||
3 | 24 | Monomer | H | Me | A | 4.6 ± 0.2 | n.d. | >1.5 |
25 | Me | 26.1 ± 0.1 | 6.3 | |||||
4 | 12 (UdSBI-4377) | Dimer | H | Me | B | 0.28 ± 0.08 | 0.1 ± 0.0 | n.d. |
22 | Me | 0.9 ± 0.3 | 3.1 ± 0.0 | |||||
5 | 5 | Monomer | H |
| iPr | 3.5 ± 0.1 | 1.6 | 9.3 |
26 | Me | 15 ± 3 | 6.3 | |||||
6 | 8 (UdSBI-0545) | Dimer | H | E | iPr | 0.4 ± 0.1 | 0.4 ± 0.4 | n.d. |
27 | Me | 0.4 ± 0.2 | <0.1 | |||||
7 | 6 | Dimer | H | C | iPr | 0.9 ± 0.4 | 0.4 ± 0.3 | – |
8 | 11 | Dimer | H | Me | D | 0.4 ± 0.2 | 0.1 ± 0.0 | – |
9 | 15 | Dimer | H |
| iPr | 1.2 ± 0.8 | 0.2 ± 0.1 | n.d. |
28 | Me | 1.8 ± 0.1 | n.d. |


