
Abstract
Integrating a carbon dioxide energy storage system (CES) with an integrated energy system (IES) can significantly enhance renewable energy utilization, reduce carbon emissions, and improve both economic and environmental performance. This paper proposes an optimal scheduling strategy for a gas–liquid phase change CES coupled with wind and solar generation, considering multi-layer low-carbon benefits. At the system structural level, an IES operation framework integrating carbon capture and storage (CCS) and power-to-gas (P2G) technologies is developed to fully exploit the potential of CO2 capture and utilization. At the technical level, a mathematical model of gas–liquid phase change CES coupled with wind and solar is established to enhance renewable energy absorption. Based on a life cycle cost model of gas–liquid phase change CES, the economic and low-carbon advantages of CES are pointed out. By introducing a stepped carbon trading mechanism at the policy level, an IES scheduling model with the goal of considering the comprehensive economic optimization of low-carbon benefits is established. The results of the scene show that the proposed method reduces the system carbon emissions by 33.26%, increases the new energy consumption rate by 3.54%, and reduces the total operating cost of the system by 24.30%, which lays a theoretical foundation for the research of environmentally friendly IES.
Introduction
In the context of the increasingly severe global climate challenges, carbon neutrality has become an important goal of energy and power development in many countries and regions. China has clearly put forward the strategic goal of reaching the peak of carbon emissions by 2030 and achieving carbon neutrality by 20601,2. The core of achieving the goal is to reduce the use of fossil energy and promote the development of new energy technologies, which is also the key path to achieve energy transformation3,4. Therefore, it is an effective way to achieve carbon neutrality in power systems by vigorously developing an integrated energy system with clean coal-fired technology, fluctuating renewable energy and cost-effective energy storage5.
In the process of global carbon neutrality, CCS technology has become one of the clean coal-fired technologies to reduce carbon emissions. Li et al. discussed the research progress of CCS technology and its key role in mitigating climate change6. Caesary et al.7 evaluated the economic feasibility of CCS technology by comparing the cost of carbon dioxide emission reduction with the cost of social carbon emission Fan et al.8 evaluated the economic benefits of using CCS to achieve low-carbon transformation of coal-fired power plants, and analyzed the commercialization cost of CCS and the potential of CCS transformation in China. However, the above research focuses on the independent operation of thermal power plants and has not been applied to multi-energy systems. Tang et al.9 proposed an IES optimal scheduling strategy based on electricity-heat-hydrogen, and verified the advantages of IES in reducing system carbon emissions and operating costs. Yang et al. proposed an IES model including CCS, P2G and combined heat and power (CHP). It is verified that the IES with power system as the core and integrating energy networks such as heat and gas can significantly improve economic efficiency and reduce carbon emissions10. The above research reduces carbon emissions through the coupling of P2G and CCS. However, from the perspective of IES as a whole, some of the CO2 supplied by CCS to P2G and the CO2 produced by CHP and gas boiler (GB) burning natural gas are finally emitted into the atmosphere through CHP and GB, failing to fully consider the possibility of gas turbines in reducing carbon emissions.
Large-scale renewable energy interconnection is an inevitable trend in the development of energy systems. However, due to the volatility, randomness and low regulation of renewable energy, high proportion of interconnection will face problems such as energy consumption and power system security and stability11,12. Therefore, domestic and foreign scholars have proposed the coupling and complementary application of renewable energy and energy storage system to solve the problems of IES power abandonment and insufficient regulation capacity.
Zesen et al.13 proposed a joint control and optimization technology of “renewable energy + energy storage + synchronous frequency regulator, " which significantly improved the power generation efficiency and new energy consumption rate of renewable energy equipment. Yang et al.14 proposed a distribution network optimization strategy combining demand side response and bidirectional dynamic reconfiguration of renewable energy distribution and storage, which improved the economy and stability of distribution network operation. Caifeng et al.15 analyzed the economy of the combined operation of wind power and energy storage, and the results show that the new system of ' wind power + energy storage ' has good economy. Aliabadi et al.16 proposed a robust optimization method for hybrid photovoltaic-wind-battery system in distribution network, which effectively reduced the active power loss and voltage fluctuation of the system. Daraz et al.17 proposed a new frequency stabilization method based on improved fractional-order angle controller for power systems with multiple energy interconnections such as photovoltaic, wind power generation and energy storage, which solves the frequency stability problem of power systems integrated with new energy and energy storage devices.
Junsheng et al.18 proposed a composite electrochemical energy storage device using lithium-ion batteries and electrochemical capacitors, which can simultaneously achieve high energy density and high power density of energy storage devices. Tatsuya et al.19 analyzed the advantages of microgrid in minimizing system operating costs and increasing photovoltaic installed capacity when considering the combined operation of ' photovoltaic + hydrogen storage. The electrochemical energy storage proposed in the above research has high efficiency, mature technology and flexible output, but it has high cost and short service life20. The energy density of hydrogen storage is high, which is much higher than that of lithium battery and other electrochemical energy storage. It can store more energy in a smaller volume, but its cost is higher and the energy loss is higher than other commonly used energy storage technologies. In addition, hydrogen storage is mainly used in microgrid, and the adaptability to new energy sources such as wind power needs to be improved. It is difficult to achieve large-scale application21,22.
Dewevre et al. introduced a new type of physical energy storage technology based on compressed carbon dioxide energy storage. This energy storage technology has large energy storage capacity, long energy storage time, low cost and is not limited by geographical conditions. It has good development prospects and application potential23. Yuke et al.24 analyzed the feasibility of liquid carbon dioxide energy storage technology, and verified that liquid carbon dioxide energy storage technology can achieve higher energy storage density and stable power output. Yuan et al.25 analyzed the influence of compressor isentropic efficiency and other parameters on the system performance of compressed carbon dioxide energy storage, and expanded the research on carbon dioxide energy storage. Yu et al.26 proposed a carbon dioxide energy storage system based on gas–liquid phase change, which can achieve higher energy storage efficiency while reducing the investment cost of energy storage. However, there are few studies on CES based on gas–liquid phase transition, and few studies have used it to coordinate and optimize with new energy in IES.
In summary, the IES optimal scheduling strategy considering low-carbon benefits is proposed at the technical and policy levels to improve the economic and environmental benefits of the system. At the technical level, first of all, CCS and P2G are used to operate together to convert some of the captured CO2 into natural gas by P2G, reducing the carbon storage of the system. Secondly, the mathematical model of wind-solar coupled gas–liquid phase change CES is established to improve the system’s new energy absorption capacity. Finally, the life cycle cost model of CES energy storage is constructed. Taking electrochemical energy storage (EES) as a comparison, the economic advantages of gas–liquid phase change CES in total energy storage cost and levelized cost of energy (LCOE) are analyzed. At the policy level, the stepped carbon trading mechanism is introduced to encourage power generation enterprises to actively reduce carbon emissions. In order to achieve the optimal operating cost of IES as the objective function, an IES optimal scheduling model with gas–liquid phase change carbon dioxide energy storage considering multi-layer low-carbon benefits is constructed, and the low-carbon potential of the system is further explored. The simulation example verifies the correctness and feasibility of the proposed model and method, and promotes the effectiveness of IES low-carbon operation.
The core contribution of this paper lies in proposing a multi-layer low-carbon benefit-driven scheduling model for integrated energy systems (IES) to address the following research gaps: (1) For the first time, CCS-P2G-gas–liquid phase change CES is integrated into the integrated energy system to form a’ capture-conversion-storage-transaction ' full-chain low-carbon architecture. (2) A coupled mathematical model of CES and renewable energy is established to address the lack of multi-energy synergy consideration in existing research. (3) The total cost and levelized cost of electricity (LCOE) of CES are quantitatively analyzed, providing new insights into the economic feasibility of deploying CES in IES.
IES operation framework and mathematical model considering low-carbon benefits
IES low-carbon operation framework considering CES
The main function of IES is to realize the joint operation of energy systems, such as electric power, natural gas, heating and cooling systems, to provide efficient, low-carbon and reliable energy supply27,28,29. The proposed IES is mainly composed of thermal power units, CHP, GB, wind turbines, photovoltaic turbines, CCS, P2G, CES, thermal energy storage (TES). IES low-carbon operation framework considering CES and the energy coupling relationship between them are shown in Fig. 1. During the operation of IES, coal, natural gas, wind power and photovoltaic are used as primary energy, which is provided to thermal power units, CHP and GB for electric and heat generation to meet the needs of electric load and heat load. CES and TES are used to realize the storage and release of electric and heat respectively. The multi-layer utilization of CO2 is realized through CCS, P2G, CES and carbon trading.

IES low-carbon operation framework considering CES.
The multi-layer low-carbon benefits of IES are reflected in the following aspects: Firstly, the thermal power unit and CHP and GB are coupled with CCS to effectively capture the generated CO2. Secondly, part of the captured CO2 is compressed and stored for a long time, and the other part of the captured CO2 is transported to the P2G device, and the CO2 is reacted with H2 to generate CH4 by using part of the new energy power. Then, a small amount of gaseous CO2 is compressed into a liquid state by CES for storage. When the power demand increases, these liquid CO2 used for CES compression can release energy to balance the electric load. Finally, the policy of carbon trading is used to encourage power generation enterprises to actively reduce carbon emissions in order to obtain more benefits, so as to further tap the low-carbon performance and economic benefits of the system.
Mathematical models of each unit of IES
CCPP
Thermal power units coupled with CCS is called carbon capture power plant(CCPP). CCS can not only realize the low-carbon transformation of thermal power units, but also independently and flexibly control the output and carbon emissions of thermal power units30,31.The working principle of CCS is as follows: first, a large amount of CO2 produced by thermal power units is captured, and then CO2 is compressed and sealed. Its energy consumption mainly includes fixed energy consumption and operating energy consumption32,33.
The mathematical model of the CCPP is:
where \(P_{i,t}^{S}\) is the total output of the unit i at time t; \(P_{i,t}^{S,N}\) is the output to the power grid of the unit i at time t;\(P_{t}^{S,CCS}\) is the total energy consumption of CCS; \(P_{i,t}^{S,Y}\) is the operating energy consumption of the unit i at time t;\(P_{D}\) is the fixed energy consumption of CCS; \(\lambda_{S}\) is the energy consumption of CCS capturing unit CO2 from CCPP; \(E_{i,t}^{S,CCS}\) is the total amount of CO2 captured by the unit i at time t; \(e_{gi}\) is the carbon emission intensity of the unit i; \(\beta_{S}\) is carbon capture efficiency.
P2G
P2G not only provides a reliable method to realize the interconnection of energy systems, but also provides a new idea for the consumption of new energy power34. The working principle of P2G is as follows: H2 produced by water electrolysis and part of CO2 captured by CCS react to form natural gas. The energy consumption of water electrolysis is mainly provided by new energy power35.
The mathematical model of P2G coupling wind power and photovoltaic is:
where \(E_{t}^{P2G}\) is the CO2 required for P2G at time t; \(\alpha_{{CO_{2} }}\) is the CO2 required to generate unit natural gas; \(\eta_{P2G}\) is the efficiency of P2G; \(P_{t}^{P2G}\) is the abandoned wind power and photovoltaic consumed by P2G at time t; \(V_{t}^{P2G}\) is the volume of natural gas generated by P2G at time t; \(H_{g}\) is the calorific value of natural gas. \(P_{t}^{WA} ,P_{t}^{VA}\) are the amount of abandoned wind power and photovoltaic at time t.
CHP and GB
CHP uses natural gas as fuel to generate heat energy and electric energy; GB uses natural gas as fuel to produce heat energy. CHP and GB can realize the coordinated operation of power system, heat system and natural gas system36. CO2 will be produced during the combustion of natural gas. In order to reduce the CO2 emitted by CHP and GB into the atmosphere, it is considered to couple the CHP and GB with CCS to capture and store the generated CO2 to reduce the carbon emission of the system.
The mathematical model of CHP coupled with CCS is:
where \(P_{t}^{PH} ,P_{t}^{CHP} ,H_{t}^{CHP}\) are the total power, electric power and heat power output of CHP at time t; \(P_{t}^{CHP,CCS}\) is the energy consumption of CCS of CHP at time t; \(\eta_{CHP,e} ,\eta_{CHP,h}\) are the electric efficiency and heat efficiency of CHP; \(V_{t}^{CHP}\) is the natural gas consumed by CHP at time t; \(P_{t}^{CHP,Y}\) is the operation energy consumption of CCS of CHP at time t; \(\lambda_{CHP}\) is the energy consumption of CCS of CHP to capture unit CO2; \(E_{t}^{PH,CCS}\) is the total amount of CO2 captured by CCS of CHP at time t; \(E_{t}^{PH}\) is the total amount of CO2 produced by CHP at time t; \(e_{PH}\) is the carbon emission intensity of CHP; \(\beta_{CHP}\) is the carbon capture efficiency of CCS for CHP.
The mathematical model of GB unit coupled with CCS is:
where \(H_{t}^{GB}\) is the heat output of GB at time t; \(V_{t}^{GB}\) is the amount of natural gas consumed by GB at time t; \(\eta_{GB}\) is the heat efficiency of GB; \(P_{t}^{GB,CCS}\) is the total energy consumption of CCS of GB at time t; \(P_{t}^{GB,Y}\) is the operation energy consumption of CCS of GB at time t; \(\lambda_{GB}\) is the energy consumption of CCS of GB to capture unit amount of CO2; \(E_{t}^{GB,CCS}\) is the total amount of CO2 captured by CCS of GB at time t; \(E_{t}^{GB}\) is the total amount of CO2 produced by GB at time t; \(e_{GB}\) is GB carbon emission intensity of GB; \(\beta_{GB}\) is the CCS carbon capture efficiency of GB.
CES mathematics and cost model based on gas–liquid phase change
The operation principle of CES based on gas–liquid phase change
The basic principle of CES based on gas–liquid phase change is to compress or expand CO2 during the cycle to achieve energy storage and release. CES is mainly composed of normal temperature and pressure gas storage tank, high pressure storage tank, metering valve, heat storage tank, inter-cooler, re-heater, compressor, turbine and condenser. It mainly includes multi-stage compression, inter-stage cooling, multi-stage expansion, inter-stage reheat, condensation and other operation processes. The operation of CES is divided into two stages: energy storage stage and energy release stage37.
Energy storage stage: during the valley period of electricity consumption, the surplus electric power is used to drive the compressor to compress the CO2 at normal temperature and pressure in the gas storage tank, and the heat generated in the compression is stored in the heat storage tank through the heat storage medium. After multi-stage compression and inter-stage heat transfer, the gaseous CO2 is further cooled by the condenser to convert gaseous CO2 into liquid CO2 and stored in a high-pressure tank. The energy storage stage stores electric energy in the form of potential energy and heat energy.
Energy release stage: during the peak period of electricity consumption, the liquid CO2 in the high-pressure storage tank is depressurized by the metering valve and flows through the condenser. The liquid CO2 absorbs heat and vaporizes in the condenser. At the same time, there is enough cold energy in the condenser to convert the compressed gaseous CO2 into liquid CO2 in the next energy storage, and then flows through the heat storage tank. The stored heat is used to heat the gaseous CO2 into high temperature and high pressure CO2 to drive the turbine to work. Finally, it is cooled by the condenser to CO2 at normal temperature and pressure and stored in the gas storage tank. The energy release stage converts heat energy and potential energy into electrical energy output.
The operation principle of CES based on gas–liquid phase change is shown in Fig. 2:

Operation principle of CES based on gas–liquid phase change.
Mathematical model of CES based on gas–liquid phase change coupling wind power and photovoltaic
Due to the complex working conditions of CES based on gas–liquid phase change, the mathematical model is reasonably simplified: CES runs under stable conditions, ignoring the influence of kinetic energy and potential energy changes.Ignore the pressure loss and heat loss of pipes and pipes in CES.The cooling water inlet state of CES is normal temperature and pressure, and the amount of water is sufficient, and the water temperature is constant during condensation and cooling.The operation time of the energy storage stage and the energy release stage of the system is the same, and the CO2 mass flow of the two stages is also the same.
Based on the above assumptions, the mathematical model of CES based on gas–liquid phase change is:
where \(m,n\) are the stages of compressor and turbine; \(\eta_{m,c} ,\eta_{n,g}\) are the efficiency of compressors and turbines at all levels; \(P_{t}^{CESC}\) s the charging power of CES at time t; \(P_{t}^{cesc}\) is the abandoned wind power and photovoltaic consumed by CES at time t; \(P_{t}^{CESD}\) is the CES discharge power at time t; \(P_{t}^{cesd}\) is the power of CES supply system at time t; \(S_{t}^{CES}\) is the power storage of CES at time t.
(2) The same type of heat exchanger is used in CES, so the calculation method is the same, which can be expressed as:
where \(\Delta T_{hot} ,\Delta T_{cold}\) are the temperature difference between the hot end and the cold end of the heat exchanger; \(T_{h,in}\) is the inlet temperature of the hot fluid of the heat exchanger; \(T_{c,out}\) is the outlet temperature of cold fluid in heat exchanger; \(T_{h,out}\) is the outlet temperature of the hot fluid of the heat exchanger;\(T_{c,in}\) is the inlet temperature of cold fluid in heat exchanger.
(3) The energy storage efficiency of CES based on gas–liquid phase change can be defined as the ratio of the total output power of the energy release process to the total input power of the energy storage process:
where \(\eta_{stor}\) is the energy storage efficiency of CES; \(t_{d}\) is the working time of CES energy release process; \(t_{c}\) is the working time of CES energy storage process.
(4) The energy density of CES can be defined as the ratio of the total output power of the system to the total volume of the system storage container:
where \(D_{CES}\) is the energy density of CES; \(V_{i}\) is the volume of CO2 storage tank.
The life cycle cost model and economic analysis of CES
The life cycle cost model of CES
The cost of energy storage power station refers to the total cost invested in the service life of the energy storage power station, including initial investment cost, operation and maintenance cost, battery swapping cost, charging cost and depreciation income. LCOE refers to the ratio of the total cost of the energy storage power station to the total on-grid power of the whole life cycle of the energy storage power station, and its significance lies in quantifying the discharge cost of the energy storage system38. In the calculation of LCOE, the influence of parameters such as charge and discharge depth, efficiency and capacity decay rate of energy storage medium is fully considered, and the LCOE of EES and CES is calculated more accurately and comprehensively.
The LCOE calculation formula of the energy storage power station is :
where\(LCOE\)is the levelized cost of energy storage power station ;\({C^{in}}\)is the initial investment cost of energy storage power station ;\({C^{om}}\)is the operation and maintenance cost of energy storage power station ;\({C^{rep}}\)is the battery swapping cost of energy storage power station ;\({C^{cha}}\)is the charging cost of the energy storage power station ;\({C^{rec}}\)is the power exchange cost of the energy storage power station ;\({E_{total}}\)is the total life cycle power generation of energy storage power station.
-
(1)
Initial investment cost of energy storage power station.
The initial investment cost of energy storage power station is divided into energy storage capacity cost and power cost. The initial investment cost of CES is primarily composed of the costs of its key components, including the compressor, turbine, heat exchangers, and pressure storage tanks. The calculation formula of the initial investment cost of the energy storage power station is:
where \(c^{P}\) is the investment cost of unit power; \(c^{E}\) is the investment cost of unit capacity; \(P\) is the rated power of the energy storage power station; \(E\) is the rated capacity of the energy storage power station. \(C^{{{\text{comp}}}}\) is the cost of compressor; \(C^{{{\text{turb}}}}\) is the cost of turbine; \(C^{{{\text{liquid}}}}\) is the cost of liquid storage tank; \(C^{{{\text{gas}}}}\) is the cost of gas storage tank; \(C^{{{\text{heater}}}}\) is the cost of heat exchanger.
-
(2)
Operation and maintenance cost of energy storage power station.
The operation and maintenance cost of energy storage power station refers to the cost of energy storage system in the process of operation and maintenance every year, mainly including maintenance cost and labor cost. Considering the discount rate, it can be estimated according to a certain proportion of investment cost. The operation and maintenance cost calculation formula of energy storage power station is:
where \(\mu\) is the annual operation and maintenance cost coefficient; \(r\) is the discount rate of energy storage power station; \(n\) is the operation year of energy storage power station; \(N\) is the service life of energy storage power station.
-
(3)
Battery swapping cost of energy storage power station.
With the increase of charging and discharging cycles of energy storage power station, its performance is difficult to meet the requirements of energy storage equipment. It is necessary to replace energy storage equipment to improve the operation efficiency of energy storage power station. The calculation formula of the battery swapping cost of the energy storage power station is:
where \({C^{rep}}\) is the battery swapping cost of unit capacity.
-
(4)
Charging cost of energy storage power station.
When the energy storage power station is charged, it is necessary to purchase power from the power grid. If the energy storage power station is coupled with the new energy power generation equipment, that is, when the power is provided by the surplus new energy power during charging, the charging cost of the energy storage power station is no longer considered. The charging cost calculation formula of energy storage power station is:
where \({T_n}\) is the number of annual cycles of energy storage power station; \(\theta_{dod}\) is the charge and discharge depth of energy storage power station.
-
(5)
Depreciation income of energy storage power station.
The energy storage power station will generate losses with the operation process, and its value will decrease with the use process. After the end of the life of the energy storage power station, the recovery of the energy storage power station can offset part of the cost, which is called the depreciation income of the energy storage power station, which is related to the investment cost of the energy storage power station. The depreciation income calculation formula of energy storage power station is:
where \(\gamma\) is the depreciation rate of energy storage power station.
-
(6)
The total power of the whole life cycle of the energy storage power station.
The total power of the energy storage power station in the whole life cycle is the total power supply to the power grid during the period from installation to final shutdown. The calculation formula of the total on-grid power of the whole life cycle of the energy storage power station is:
where \(\varphi\)is the efficiency of energy storage power station; \(\eta\)is the annual cycle attenuation rate of the energy storage power station.
-
(7)
The load factor and utilization rate of energy storage power station.
ual cycle attenuation rate of the energy storage power station.
The load factor of the energy storage power station refers to the ratio of the actual discharge amount of the energy storage power station to its theoretical discharge amount. The calculation formula is:
where \({\text{LF}}\) is the load factor of the energy storage power station.
The utilization rate of energy storage power station refers to the proportion of the actual capacity of energy storage power station to its maximum available capacity, which is usually used to evaluate whether the equipment is fully scheduled. The calculation formula is:
where \({\text{UR}}\) is the utilization rate of energy storage power station.
The economic analysis of CES
Taking the life cycle cost and LCOE of energy storage power station as the evaluation criteria, the economy of two commonly used energy storage power stations, EES and CES, is analyzed. The economic parameters of the energy storage system are shown in Table 1, while the cost calculations for the main components of CES are shown in Table 2.
-
(1)
If the charging cost is taken into account, that is, when the energy storage power station is not coupled with the new energy power generation equipment, the relationship between the total cost of EES and CES, the relationship between LCOE and the rated power and rated capacity of the energy storage power station is shown in Fig. 3.
Fig. 3 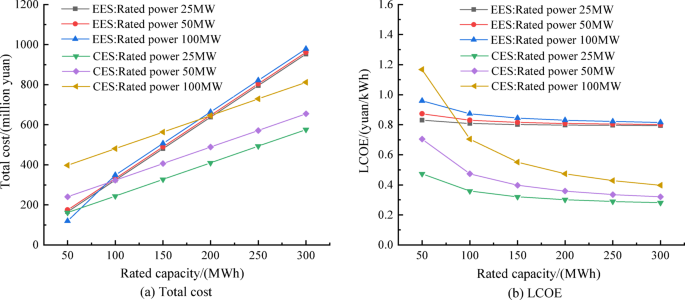
Comparison of total life cycle cost and LCOE of EES and CES considering charging cost.

Taking the energy storage power station with a rated power of 50 MW as an example, as the rated capacity of the energy storage power station increases from 50 to 300 MWh:
According to the analysis of Fig. 3a, the total life cycle cost of EES increased from 174 million yuan to 961 million yuan, an increase of 552.3%. The total life cycle cost of CES increased from 240 million yuan to 654 million yuan, an increase of 272.5%.It can be seen from Fig. 3b that the LCOE of EES decreases from 0.87 to 0.80 yuan/kWh. The LCOE of CES was reduced from 0.71 to 0.32 yuan/kWh. Although both LCOEs are reduced, CES has a lower LCOE, which is more in line with the application goal of large-scale energy storage of 0.3–0.4 yuan/kWh, and it is suitable for large-scale energy storage. With the increase of the rated capacity of energy storage equipment, the capacity investment cost caused by the increase of the number of battery units increases significantly, which increases the total cost of energy storage system. However, when the capacity of the energy storage device increases, a shallower charge and discharge depth can be achieved under the same output power conditions, which increases the total discharge capacity that the energy storage system can release throughout the life cycle. According to the analysis of Formula (9), although the increase of initial investment cost leads to the increase of molecules, the total discharge amount of denominator increases more significantly, which ultimately drives LCOE to show a downward trend. From the above analysis, it can be seen that through the reasonable expansion of the capacity of energy storage equipment, the economy of the whole life cycle of energy storage system can be improved while ensuring the power regulation ability of the system, and the advantages of large-scale configuration of energy storage equipment are revealed.
-
(2)
If the charging cost is not considered, that is, when the energy storage power station is coupled with the new energy power generation equipment, the relationship between the total cost of EES and CES, LCOE and the rated power and rated capacity of the energy storage power station is shown in Fig. 4. Taking the 50 MW/150MWh energy storage power station as an example:
Fig. 4 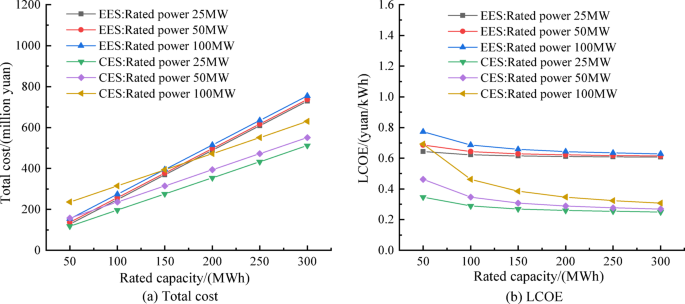
Comparison of the total life cycle cost and LCOE of EES and CES without considering the charging cost.

By comparing Figs. 3a and 4a, we can see: According to the comparison diagram and diagram, after considering the coupling of energy storage power station and new energy power generation equipment, the total cost of EES life cycle is reduced from 489 million yuan to 377 million yuan because the charging cost of energy storage power station is no longer needed to be considered. The total life cycle cost of CES decreased from 405 million yuan to 315 million yuan. By comparing Figs. 3b and 4b, we can see: The LCOE of EES was reduced from 0.82 to 0.63 yuan/kWh. The LCOE of CES was reduced from 0.40 to 0.31 yuan/kWh. When the charging cost is taken into account, the electric energy purchase cost in the charging and discharging cycle needs to be borne additionally. After coupling new energy power generation equipment, charging can be completed by using new energy power abandonment or low-cost period power, which can effectively avoid the high-price power purchase cost of the power grid, thus reducing the total life cycle cost. According to the analysis of formula (9), the operation mode of new energy distribution and storage further reduces the total life cycle cost of energy storage equipment, and also further reduces the LCOE of energy storage equipment, which verifies the cost advantage of ' new energy power generation + energy storage ' collaborative planning strategy.
Optimal scheduling model of IES
The proposed IES takes the output of CCPP, CHP, GB and the output of energy storage power station as decision variables, and takes the minimum total cost of system operation as the objective function to construct the optimal scheduling model of the whole system.
Objective function
The objective function of the IES system with gas–liquid phase change CES considering multi-layer low-carbon benefits is:
where \(C_{S}\) is the cost of CCPP; \(C_{B}\) is the cost of CHP and GB; \(C_{P}\) is the cost of P2G; \(C_{C}\) is the cost of carbon sequestration; \(C_{T}\) is the cost of carbon trading; \(C_{A}\) is the cost of abandoning wind power and photovoltaic; \(C_{ES}\) is the cost of energy storage power station; \(C\) is the total cost of system operation.
The operation cost of each unit of IES.
-
(1)
The cost of CCPP
$$C_{S} = \sum\limits_{t = 1}^{24} {\sum\limits_{i = 1}^{{N_{S} }} {U_{i,t} \left( {a_{i} (P_{i,t}^{S} )^{2} + b_{i} P_{i,t}^{S} + c_{i} } \right)} }$$(19)where \(U_{i,t}\) is the start-stop state of the unit i at time t; \(N_{S}\) is the number of CCPP; \(a_{i} ,b_{i} ,c_{i}\) is the coal consumption cost coefficient of the unit i.
-
(2)
The cost of CHP and GB.
The cost of CHP and GB is mainly the cost of buying natural gas, so its cost is defined as:
where \(k_{{CH_{4} }}\) is the price of unit natural gas; \(V_{t}^{BUY}\) is the volume of natural gas purchased at time t.
-
(3)
The cost of P2G.
P2G will have power consumption during operation and needs to buy CO2 as a raw material, so its cost is defined as:
where \(k_{P2G}\) is the operating cost coefficient of P2G; \(k_{{CO_{2} }}\) is the cost of purchasing unit CO2.
-
(4)
The cost of carbon sequestration.
The CO2 captured by CCS needs to be sealed, and the cost of carbon sequestration is, so its cost is defined as:
where \(k_{s}\) is the cost coefficient of carbon sequestration; \(P_{t}^{CCS}\) is the total energy consumption of CCS at time t;\(E_{t}^{CCS}\) is the total amount of CO2 stored at time t.
-
(5)
The penalty cost of abandoning wind power and photovoltaic.
When new energy power generation equipment abandons wind power and photovoltaic, it will be punished accordingly, so its cost is defined as:
where \(k_{w} ,k_{v}\) is the penalty coefficient of abandoning wind power and photovoltaic;\(P_{t}^{A}\) is the total amount of abandoned wind power and photovoltaic;\(P_{t}^{WA} ,P_{t}^{VA}\) is the amount of abandoned wind power and photovoltaic at time t.
-
(6)
The cost of energy storage power station.
In the quantitative analysis of energy storage system operating costs, the "product of grid feed-in energy and LCOE" is adopted to characterize the short-term costs of energy storage equipment during the dispatch period, serving as its intra-day dispatch cost. LCOE, which reflects the comprehensive lifecycle costs of energy storage, is integrated with grid feed-in energy that quantifies the actual electricity delivered by the storage system to the grid during the dispatch period, thereby capturing its short-term operational contribution to system scheduling.
-
(7)
The analysis of carbon trading mechanism.
Carbon trading means that when the system’s carbon emissions do not reach its carbon emission quota, the remaining carbon emission quota can be sold for income; if carbon emissions exceed carbon emission quotas, additional carbon emission quotas need to be purchased40. The application of carbon trading market to IES can not only improve the economic benefits of the system and reduce the carbon emissions of the system41,42, but also effectively promote the enthusiasm of enterprises to reduce carbon emissions in practical applications43.
At present, traditional carbon trading and stepped carbon trading are commonly used.
-
(a)
Traditional carbon trading.
Traditional carbon trading refers to trading carbon emissions quotas at the same price. The model of traditional carbon trading is:
where \(\chi\) is the price of unit carbon emission quota; \(E_{t}^{Q}\) is the total carbon emission quota of the system at time t;\(E_{t}^{Total}\) is the actual carbon emissions of the whole system at time t; \(E_{t}^{jy}\) is the amount of CO2 involved in carbon trading at time t;\(\mu_{S} ,\mu_{PH} ,\mu_{GB}\) is the carbon emission quota coefficient of CCPP, CHP and GB.
-
(b)
Stepped carbon trading.
Stepped carbon trading mechanism divides multiple carbon emission quota purchase intervals. The more carbon emission quotas need to be purchased, the higher the price of carbon emission quotas in the corresponding interval. The model of stepped carbon trading is:
where \(\delta\) is the price compensation rate in the negative carbon interval; \(\theta\) is the positive carbon interval price growth rate; \(L\) is the width of carbon trading interval.
Constraint condition
-
(1)
The constraints of electric power and heat power balance
$$\left\{ \begin{gathered} P_{t}^{S} + P_{t}^{CHP} + P_{t}^{W} + P_{t}^{V} + P_{t}^{CESD} = \hfill \\ P_{t}^{EL} + P_{t}^{P2G} + P_{t}^{CCS} + P_{t}^{CESC} + P_{t}^{A} \hfill \\ H_{t}^{CHP} + H_{t}^{GB} + H_{t}^{TSD} = H_{t}^{HL} + H_{t}^{TSC} \hfill \\ \end{gathered} \right.$$(27)where \(P_{t}^{EL}\) is the electric load at time t; \(P_{t}^{W} ,P_{t}^{V}\) are the predicted power of wind power and photovoltaic at time t.\(H_{t}^{HL}\) is the heat load at time t.
-
(2)
The constraints of CCPP.
Considering the additional costs that will be generated during the start-up and shutdown of thermal power units, considering the start-up and shutdown costs can reduce the total operating costs, optimize power dispatching, and improve economy.
where \(P_{\max }^{S} ,P_{\min }^{S}\) are the upper and lower limits of the output of the CCPP. \(P_{t}^{S}\) is the output of CCPP at time t; \(\Delta P^{S}\) is the climbing power constraint of CCPP. \(T_{\min }^{on} ,T_{\min }^{off}\) are the minimum start and stop time; \(T_{t - 1}^{on} ,T_{t - 1}^{off}\) are the continuous start and stop time at time t − 1.
-
(3)
The constraints of CHP
$$\left\{ \begin{gathered} P_{\min }^{CHP} \le P_{t}^{CHP} \le P_{\max }^{CHP} \hfill \\ H_{\min }^{CHP} \le H_{t}^{CHP} \le H_{\max }^{CHP} \hfill \\ \left| {P_{{\text{t + 1}}}^{PH} - P_{t}^{PH} } \right| \le \Delta P^{PH} \hfill \\ \end{gathered} \right.$$(29)where \(P_{\max }^{CHP} ,P_{\min }^{CHP}\) are the upper and lower limits of the power output of the CHP; \(H_{\max }^{CHP} ,H_{\min }^{CHP}\) are the upper and lower limits of the heat output of the CHP; \(P_{t}^{PH}\) is the output of CHP at time t; \(\Delta P^{PH}\) is the climbing power constraint of CHP.
-
(4)
The constraints of GB
$$\left\{ \begin{gathered} H_{\min }^{GB} \le H_{t}^{GB} \le H_{\max }^{GB} \hfill \\ \left| {H_{{\text{t + 1}}}^{GB} - H_{t}^{GB} } \right| \le \Delta H^{GB} \hfill \\ \end{gathered} \right.$$(30)where \(H_{\max }^{GB} ,H_{\min }^{GB}\) are the upper and lower limits of the heat output of GB; \(H_{t}^{GB}\) is the GB heat output at time t; \(\Delta H^{GB}\) is the climbing power constraint of GB.
-
(5)
The constraints of wind power
$$\left\{ \begin{gathered} P_{t}^{W} = P_{t}^{WN} + P_{t}^{WA} \hfill \\ 0 \le P_{t}^{WN} \le P_{t}^{W} \hfill \\ 0 \le P_{t}^{WA} \le P_{t}^{W} \hfill \\ \end{gathered} \right.$$(31)where \(P_{t}^{WN}\) is the output of wind power at time t.
-
(6)
The constraints of photovoltaic
$$\left\{ \begin{gathered} P_{t}^{V} = P_{t}^{VN} + P_{t}^{VA} \hfill \\ 0 \le P_{t}^{VN} \le P_{t}^{V} \hfill \\ 0 \le P_{t}^{VA} \le P_{t}^{V} \hfill \\ \end{gathered} \right.$$(32)where \(P_{t}^{VN}\) is the output of photovoltaic at time t.
-
(7)
The constraints of P2G
$$P_{\min }^{P2G} \le P_{t}^{P2G} \le P_{\max }^{P2G}$$(33)where \(P_{\max }^{P2G} ,P_{\min }^{P2G}\) are the upper and lower limits of operating power of P2G.
-
(8)
The constraints of CCS
$$P_{\min }^{CCS} \le P_{t}^{CCS} \le P_{\max }^{CCS}$$(34)where \(P_{\max }^{CCS} ,P_{\min }^{CCS}\) are t the upper and lower limits of operating power of CCS.
-
(9)
The constraints of energy storage power station
$$\left\{ \begin{gathered} 0 \le \mu_{t}^{ESC} + \mu_{t}^{ESD} \le 1 \hfill \\ 0 \le \mu_{t}^{TSC} + \mu_{t}^{TSD} \le 1 \hfill \\ 0 \le P_{t}^{ESC} \le P_{\max }^{ESC} \mu_{t}^{ESC} \hfill \\ 0 \le H_{t}^{TSC} \le H_{\max }^{TSC} \mu_{t}^{TSC} \hfill \\ 0 \le P_{t}^{ESD} \le P_{\max }^{ESD} \mu_{t}^{ESD} \hfill \\ 0 \le H_{t}^{TSD} \le H_{\max }^{TSD} \mu_{t}^{TSD} \hfill \\ S_{\min }^{ES} \le S_{t}^{ES} \le S_{\max }^{ES} \hfill \\ S_{\min }^{TS} \le S_{t}^{TS} \le S_{\max }^{TS} \hfill \\ S_{24}^{ES} = S_{0}^{ES} ,S_{24}^{TS} = S_{0}^{TS} \hfill \\ \end{gathered} \right.$$(35)where \(\mu_{t}^{ESC} ,\mu_{t}^{ESD}\) are the charge and discharge state of energy storage power station; \(\mu_{t}^{TSC} ,\mu_{t}^{TSD}\) are the charging and discharging states of TES; \(P_{\max }^{ESC} ,P_{\max }^{ESD}\) are the upper limits of charge and discharge of energy storage power station; \(H_{\max }^{TSC} ,H_{\max }^{TSD}\) are the upper and lower limits of charge and discharge of TES; \(S_{\max }^{ES} ,S_{\min }^{ES}\) are the upper and lower limits of capacities of energy storage power station; \(S_{0}^{ES} ,S_{24}^{ES}\) are the initial stored energy and the final stored energy of the energy storage power station; \(S_{0}^{TS} ,S_{24}^{TS}\) are the initial stored energy and the final stored energy of TES.
Analysis of examples
Simulation data and parameters
Taking 24 h as the optimal scheduling cycle, an IES optimal scheduling model with CES considering multi-layer low-carbon benefits is established. Since the scheduling model is a nonlinear model, the Gurobi solver in MATLAB is used to solve it. The electric and heat load curves, wind power and photovoltaic prediction curves are shown in Fig. 5. The selected 24-h dataset represents a typical winter day in Shaanxi Province, featuring peak heating demand and operational stress for the integrated energy system. This provides a representative basis for evaluating system performance under the most challenging load conditions. The parameters of IES are shown in Tables 3, 4, 5 and 6.

Electric and heat load curves and wind power and photovoltaic prediction curves44.
Multi-layer low-carbon benefit analysis of IES
In order to verify the low-carbon characteristics of the gas turbine coupled CCS and the low-carbon characteristics of the coordinated operation of P2G and CCS in the IES optimal scheduling, the following three scenes are set up for comparison.
-
Scene 1: Without considering the coupling of CCS and gas turbine, and P2G runs alone;
-
Scene 2: Considering the coupling of CCS and gas turbine, and P2G runs alone;
-
Scene 3: Considering the coupling of CCS and gas turbine, and cooperating with P2G;
The scheduling results of scene 1–3 are shown in Table 7, the energy consumption of CCS is shown in Fig. 6, and the carbon emission is shown in Fig. 7, the electric and heat balance of scene 1–3 is shown in Figs. 8, 9, 10.

Scene 1–3 The energy consumption of CCS.

Scene 1–3 Carbon emissions.

Scene 1 electric and heat balance.

Scene 2 electric and heat balance.

Scene 3 electric and heat balance.
-
(1)
Comparative analysis of Scene 1 and Scene 2.
It can be seen from Figs. 6, 7 and Table 7 that when the gas turbine is not coupled with CCS, although the energy consumption of CCS is low, the system carbon emissions are high. After the gas turbine is coupled with CCS, the CCS needs to increase the output to capture the CO2 of the gas turbine, resulting in an increase in the energy consumption of CCS, but the system carbon emissions are greatly reduced. Due to the increase of CO2 captured by CCS, the cost of CO2 storage increases, so the total operation cost of the system increases. Compared with scene 1, the carbon emission of scene 2 is reduced by 14.87%, which verifies the low-carbon benefit of gas turbine coupled CCS.
-
(2)
Comparative analysis of Scene 2 and Scene 3.
It can be seen from Fig. 7 and Table 7 that when P2G is running alone, the cost of P2G is higher because P2G needs to buy CO2 in addition to its own operating cost. When P2G and CCS work together, the CO2 captured by CCS can be directly input into P2G as raw material, which saves the purchase of CO2 and reduces t the cost of carbon sequestration, thereby reducing the total operating cost of the system. Compared with scene 2, the total operating cost of scene 3 system is reduced by 3.64%, which verifies the economic benefits of P2G and CCS cooperative operation.
In order to verify the low-carbon and economic benefits of the stepped carbon trading mechanism in IES optimal scheduling, the following two scenes are set for comparison.
-
Scene 4: On the basis of Scene 3, consider the traditional carbon trading mechanism;
-
Scene 5: On the basis of Scene 3, consider the stepped carbon trading mechanism;
The scheduling results of scene 4–5 are shown in Table 8, the energy consumption of CCS equipment is shown in Fig. 11, and the carbon emission is shown in Fig. 12, the electric and heat balance of scene 4–5 is shown in Figs. 13 and 14.

Scene 3–5 The energy consumption of CCS.

Scene 3–5 Carbon emissions.

Scene 4 electric and heat balance.

Scene 5 electric and heat balance.
-
(1)
Comparative analysis of Scene 3 and Scene 4.
It can be seen from Figs. 11 and 12 that after the introduction of traditional carbon trading, since the CO2 captured and stored by CCS can participate in carbon trading to obtain benefits, CCS is encouraged to increase output to capture more CO2.Therefore, the energy consumption of CCS has increased and the carbon emissions of the system have decreased. From Table 8, it can be seen that capturing more CO2 leads to an increase in CO2 storage, resulting in an increase in the cost of carbon sequestration. However, because the income from carbon trading is higher than the increased cost of CO2 storage, the total operating cost of the system is reduced. Compared with scene 3, the carbon emission of scene 4 is reduced by 5.59%, and the total operating cost of the system is reduced by 15.78%, which verifies the low-carbon and economic benefits of the carbon trading mechanism.
-
(2)
Comparative analysis of scene 4 and scene 5.
After the introduction of stepped carbon trading, due to the division of multiple carbon emission quota purchase intervals, as the more carbon emission quotas need to be purchased, the higher the cost is, and the more carbon emission quotas sold, the higher the income is, which further encourages CCS equipment to capture and store more CO2. From Fig. 11 and Table 8, it can be seen that the carbon emissions of scene 5 are further reduced, the cost of carbon storage is also increased, but the income of carbon trading is also increased accordingly, which in turn reduces the total operating cost of the system. Compared with scene 4, the carbon emission of scene 5 is reduced by 6.27%, and the total operating cost of the system is reduced by 9.96%, which verifies the effectiveness of the stepped carbon trading mechanism to promote the low-carbon economic operation of IES.
Analysis of low-carbon economic characteristics of CES based on gas–liquid phase change
In order to verify the advantages of gas–liquid phase change CES in improving the consumption rate of new energy power and reducing the cost of energy storage power station, the following two scenes are set for comparison.
-
Scene 6: On the basis of scene 5, EES is introduced to absorb the abandoned wind power and photovoltaic;
-
Scene 7: On the basis of scene 5, CES is introduced to absorb the abandoned wind power and photovoltaic;
The scheduling results of scene 5–7 are shown in Table 9, the carbon emission is shown in Fig. 15, the output of CCPP is shown in Fig. 16, and the amount of abandoned wind power and photovoltaic is shown in Fig. 17. electric and heat balance of scene 6–7 is shown in Figs. 18, 19,

Scene 5–7 Carbon emissions.

Scene 5–7 CCPP output.

Scene 5–7 Abandoned wind power and photovoltaic.

Scene 6 electric and heat balance.

Scene 7 electric and heat balance.
-
(1)
Comparative analysis of scene 5 and scene 6.
From Fig. 16 and Table 9, it can be seen that after the introduction of EES on the energy supply side of the system, due to the combination of new energy power generation and energy storage power station on the source side of the system, on the one hand, the energy storage power station can store part of the new energy power during the low demand for electricity. Therefore, the amount of abandoned wind power and photovoltaic in the system is stored by the energy storage power station, which reduces the rate of abandoned wind power and photovoltaic; on the other hand, the energy storage power station can output the stored new energy power to the system during the peak demand for electricity, so that the output of the CCPP can be reduced, thereby reducing the carbon emission of the system. Compared with scene 5, due to the cost of energy storage power station in scene 6, the total operating cost of the system increased by 37687.15 yuan, the cost of abandoned wind power and photovoltaic decreased by 39848.39 yuan, the rate of abandoned wind power and photovoltaic decreased by 2.23%, and the carbon emission decreased by 4.69%, which verified the effectiveness of EES in the consumption of new energy power and the reduction of carbon emission of the system.
-
(2)
Comparative analysis of scene 6 and scene 7.
After the introduction of CES on the energy supply side of the system, the function of CES is basically the same as EES, which can absorb new energy power, reduce the output of CCPP and reduce carbon emissions. The difference is that the energy storage of CES has lower construction cost and longer operation life than EES, so it has great advantages over EES on LCOE. Compared with the LCOE of EES in Scene 6, which is 0.6289 yuan/kWh, the LCOE of CES in Scene 7 is 0.3079 yuan/kWh, the total cost of energy storage power station is also reduced from 120780.94 to 42909.51 yuan. which verifies the advantages of CES in LCOE and reducing energy storage cost.
Conclusion
In summary, an IES optimal scheduling model for IES with gas–liquid-phase-change carbon dioxide energy storage considering multi-layer low-carbon benefits is constructed. By setting different examples for comparative analysis, the following conclusions are obtained through simulation analysis of scene 1–7:
-
(1)
After CHP and GB are coupled with CCS, the carbon emissions are reduced by 14.87%, confirming the low-carbon potential of CCS-enabled gas turbines. Coordinated operation of CCS and P2G further reduces the total system operating cost by 3.64%, demonstrating both environmental and economic advantages.
-
(2)
After considering the traditional carbon trading, the carbon emission is reduced by 5.59%, and the total operating cost of the system is reduced by 15.78%. Introducing a stepped carbon trading mechanism further reduces emissions by 6.27% and costs by 9.96%, highlighting its superior performance in promoting low-carbon and cost-effective operation.
-
(3)
Integrating gas–liquid phase change CES with wind and photovoltaic generation reduces renewable energy curtailment by 2.57% and carbon emissions by 4.69% compared to electrochemical energy storage (EES). Additionally, the LCOE is lowered from 0.6289 to 0.3079 yuan/kWh, and the total cost decreases from 120780.94 to 42909.51 yuan, confirming the significant economic and environmental benefits of CES deployment in IES.
While this study adopts a steady-state linearized model for CES to enable tractable system-level scheduling, this simplification limits the physical accuracy of CES dynamics. Future research will focus on integrating nonlinear CES models that capture pressure–temperature dependencies, efficiency variations, and thermal losses, supported by advanced optimization methods such as decomposition, surrogate modeling, and scenario-based approaches to balance accuracy and computational feasibility. Additionally, comprehensive sensitivity analyses on regional cost variations, labor dynamics, and market uncertainties will be conducted to improve the robustness of the economic assessment. Finally, the current single winter day case study will be extended to multi-seasonal and annual scenarios to fully capture seasonal variability in load demand and renewable energy generation.
Data availability
The datasets generated during and/or analyzed during the current study are available from the corresponding author on reasonable request.
Abbreviations
- CO2 :
-
Carbon dioxide
- CCS:
-
Carbon capture and storage
- CES:
-
Carbon dioxide energy storage
- CHP:
-
Combined heat and power
- CCPP:
-
Carbon capture power plant
- EES:
-
Electrochemical energy storage
- GB:
-
Gas boiler
- IES:
-
Integrated energy system
- LCOE:
-
Levelized cost of energy
- P2G:
-
Power to gas
- TES:
-
Thermal energy storage
References
Li, M. et al. Multi-objective optimization of non-fossil energy structure in China towards the carbon peaking and carbon neutrality goals. Energy 312, 133643–133643 (2024).
Wang, T. P. et al. Investigating the impacts of the Dual Carbon Targets on energy and carbon flows in China. Energy 313, 133778–133778 (2024).
Dexia, K. & Jun, L. Analysis on the development of renewable energy power application in the energy transition. IOP Conf. Series Earth Environ. Sci. 766, 012039 (2021).
Jie, M. & Silan, H. Research on China’s renewable energy policy system under the background of “dual carbon”. E3S Web of Conf. 369, 02006 (2023).
Li, Y. et al. Optimal scheduling of island integrated energy systems considering multi-uncertainties and hydrothermal simultaneous transmission: A deep reinforcement learning approach. Appl. Energy 333, 120540 (2023).
Cao, C., Zhu, H. & Hou, Z. Advances in carbon capture, utilization and storage (CCUS). Energies 17, 4784–4784 (2024).
Caesary, D., Kim, H. & Nam, J. M. Cost effectiveness of carbon capture and storage based on probability estimation of social cost of carbon. Appl. Energy 377, 124542–124542 (2025).
Fan, J. et al. Carbon capture and storage (CCS) retrofit potential of coal-fired power plants in China: The technology lock-in and cost optimization perspective. Appl. Energy 229, 326–334 (2018).
Tang, J. B. et al. Economic and low-carbon planning for interconnected integrated energy systems considering emerging technologies and future development trends. Energy 302, 131850 (2024).
Yang, C. et al. Low-carbon economic dispatch of integrated energy system with CCS-P2G-CHP. Energy Rep. 12, 42–51 (2024).
Yan, J. et al. How to choose mobile energy storage or fixed energy storage in high proportion renewable energy scenarios: Evidence in China. Appl. Energy 376, 124274–124274 (2024).
Wei, W. et al. Application of energy storage in integrated energy systems — A solution to fluctuation and uncertainty of renewable energy. J. Energy Storage 52, 104812 (2022).
Zesen, W. et al. Analysis of renewable energy consumption and economy considering the joint optimal allocation of “renewable energy + energy storage + synchronous condenser”. Sci. Rep. 13, 20376–20376 (2023).
Yang, H. et al. Scenario-driven optimization strategy for energy storage configuration in high-proportion renewable energy power systems. Processes 12, 1721–1721 (2024).
Caifeng, W. et al. Exergoeconomic analysis and optimization of wind power hybrid energy storage system. Sci. Rep. 14, 12501–12501 (2024).
Aliabadi, J. M. & Radmehr, M. Hybrid energy system optimization integrated with battery storage in radial distribution networks considering reliability and a robust framework. Sci. Rep. 14, 26597–26597 (2024).
Daraz, A. et al. Frequency stabilization of interconnected diverse power systems with integration of renewable energies and energy storage systems. Sci. Rep. 14, 25655–25655 (2024).
Jun-Sheng, Z. et al. A hybrid electrochemical device based on a synergetic inner combination of Li ion battery and Li ion capacitor for energy storage. Sci. Rep. 7, 41910 (2017).
Tatsuya, O. et al. Factors affecting the techno-economic and environmental performance of on-grid distributed hydrogen energy storage systems with solar panels. Energy 269, 126736 (2023).
Rahul, S. et al. Progress and challenges in electrochemical energy storage devices: Fabrication, electrode material, and economic aspects. Chem. Eng. J. 468, 143706 (2023).
Angelo, B. et al. Hydrogen energy storage system in a multi-technology microgrid: Technical features and performance. Int. J. Hydrogen Energy 48, 12072–12088 (2023).
Mehr, S. A. et al. Recent challenges and development of technical and technoeconomic aspects for hydrogen storage, insights at different scales; A state of art review. Int. J. Hydrogen Energy 70, 786–815 (2024).
Dewevre, F. et al. Carbon dioxide energy storage systems: Current researches and perspectives. Renew. Energy 224, 120030 (2024).
Yuke, W. et al. A technical feasibility study of a liquid carbon dioxide energy storage system: Integrated component design and off-design performance analysis. Appl. Energy 350, 121797 (2023).
Yuan, Z. et al. 5E (energy, exergy, energy level, exergoeconomic, and exergetic sustainability) analysis on a carbon dioxide binary mixture based compressed gas energy storage system: A comprehensive research and feasibility validation. Energy Conv. Manag. 292, 117399 (2023).
Yu, Z. et al. Thermal analysis of a gas-liquid compressed carbon dioxide energy storage system. J. Phys. Conf. Ser. 2788, 012012 (2024).
Jianhui, W. et al. Multi-energy coupling analysis and optimal scheduling of regional integrated energy system. Energy 254, 124482 (2022).
Nianyuan, W. et al. A review on modelling methods, tools and service of integrated energy systems in China. Progr. Energy 5, 032003 (2023).
Li, Y. et al. Enhancing cyber-resilience in integrated energy system scheduling with demand response using deep reinforcement learning. Appl. Energy 379, 124831 (2025).
Baoju, C. et al. A long-term impact assessment of carbon capture (storage) investment conducted by conventional power company on sustainable development. Appl. Energy 358, 122567 (2024).
Song, J. et al. Enhancing envrionmental sustainability via interval optimization for low-carbon economic dispatch in renewable energy power systems: Leveraging the flexible cooperation of wind energy and carbon capture power plants. J. Clean. Prod. 442, 140937 (2024).
Abdilahi, M. A. & Mustafa, W. M. Carbon capture power plants: Decoupled emission and generation outputs for economic dispatch. Int. J. Greenhouse Gas Control 63, 12–19 (2017).
Luberti, M., Ballini, E. & Capocelli, M. Unveiling the potential of cryogenic post-combustion carbon capture: from fundamentals to innovative processes. Energies 17, 2673 (2024).
Son, G. Y., Bae, S. I. & Kim, Y. S. Optimal coordination of power to gas-linked energy systems: Focused on energy policy in South Korea. Energy Rep. 11, 5323–5334 (2024).
Colelli, L. et al. Power-to-Gas: Process analysis and control strategies for dynamic catalytic methanation system. Energy Convers. Manage. 305, 118257 (2024).
Ailin, Z. et al. The optimal operation model of electric-thermal-gas integrated energy system considering multi-energy complementarity. IOP Conf. Ser. Earth Environ. Sci. 781, 042021 (2021).
Pan, Z. et al. Components design and performance analysis of a novel compressed carbon dioxide energy storage system: A pathway towards realizability. Energy Conv. Manag. 229, 113679 (2021).
Mostafa, H. M. et al. Techno-economic assessment of energy storage systems using annualized life cycle cost of storage (LCCOS) and levelized cost of energy (LCOE) metrics. J. Energy Storage 29, 101345–101345 (2020).
Wang, D., Liu, S. & Shi, D. Performance analysis of a novel compressed carbon dioxide energy storage system based on gas liquid phase change. J. Chin. Soc. Power Eng. 44, 339–347 (2024).
Guo, X., Wang, L. & Ren, D. Optimal scheduling model for virtual power plant combining carbon trading and green certificate trading. Energy 318, 134750–134750 (2025).
Zhang, J. & Liu, Z. Low carbon economic scheduling model for a park integrated energy system considering integrated demand response, ladder-type carbon trading and fine utilization of hydrogen. Energy 290, 130311 (2024).
Li, Y. et al. Optimal dispatch of low-carbon integrated energy system considering nuclear heating and carbon trading. J. Clean. Prod. 378, 134540 (2022).
Luan, L., Liu, P. & Mei, Y. The impact of pilot carbon market on firms’ performance in China. Energy Econ. 142, 108164–108164 (2025).
Cui, Y., Deng, G. & Zeng, P. Multi-time scale source-load dispatch method of power system with wind power considering low-carbon characteristics of carbon capture power plant. Proc. CSEE 42, 5869–5886 (2021).
Acknowledgements
The authors want to thank the editor and anonymous reviewers for their valuable comments and suggestions to improve the version of this article. This work was supported by the Industrial Technology Research and Development Project of Jilin Province (2024C020-4).
Author information
Authors and Affiliations
Contributions
Conceptualization, W.L., G.A., T.C. and Q.Y.; methodology, W.L. and G.A.; validation, W.L and T.C.; data curation, W.L.; writing-original draft preparation, W.L. and G.A.; writing-review and editing, G.A., T.C. and Q.Y.; supervision, W.L. and T.C.; All authors have read and agreed to the published version of the manuscript.
Corresponding author
Ethics declarations
Competing interests
The authors declare no competing interests.
Additional information
Publisher’s note
Springer Nature remains neutral with regard to jurisdictional claims in published maps and institutional affiliations.
Rights and permissions
Open Access This article is licensed under a Creative Commons Attribution-NonCommercial-NoDerivatives 4.0 International License, which permits any non-commercial use, sharing, distribution and reproduction in any medium or format, as long as you give appropriate credit to the original author(s) and the source, provide a link to the Creative Commons licence, and indicate if you modified the licensed material. You do not have permission under this licence to share adapted material derived from this article or parts of it. The images or other third party material in this article are included in the article’s Creative Commons licence, unless indicated otherwise in a credit line to the material. If material is not included in the article’s Creative Commons licence and your intended use is not permitted by statutory regulation or exceeds the permitted use, you will need to obtain permission directly from the copyright holder. To view a copy of this licence, visit http://creativecommons.org/licenses/by-nc-nd/4.0/.
About this article

Cite this article
Li, W., An, G., Cai, T. et al. Optimal scheduling of integrated energy system with gas–liquid phase change carbon dioxide energy storage considering multi-layer low-carbon benefits. Sci Rep 15, 22263 (2025). https://doi.org/10.1038/s41598-025-05438-7
Received:
Accepted:
Published:
DOI: https://doi.org/10.1038/s41598-025-05438-7
