
Abstract
Due to the long-term effects of water erosion and stress disturbance, the rock characteristics and pressure distribution of underground coal mine reservoirs will change, affecting the stability of the dam body. Therefore, the mechanical properties of rock under different water content and impact load are the key factors affecting the stability of the surrounding rock. In this paper, the quantitative relationship between dynamic compressive strength, strain, and fractal dimension of coarse sandstone and fine sandstone under different water content were studied by drop weight impact tests. The water content of sandstone can affect its mechanical properties. The dynamic compressive strength of sandstone is lower than the original state after being immersed in water, and the higher the water content, the lower the dynamic compressive strength. Besides, the strain increases with the increase of the saturation degree. It shows that water has a weakening and softening effect on sandstone, and this effect will increase with the increase in saturation. By analyzing the fracture fractal dimension of sandstone, the fracture degree of sandstone first increases, and then decreases with the increase of water saturation, which indicate that under the action of dynamic load, the influence of the sandstone fracture degree can weaken the effect of water on sandstone and the Stefan effect produced by the water on sandstone cracks. However, the weakening effect is dominant in the compressive strength of sandstone. The research results can provide theoretical guidance for the study on the stability of surrounding rock of underground coal mine reservoirs.
Introduction
As a basic energy source in China, coal is related to the development of numerous industries. For a fairly long period in the future, the status of coal as the main energy source will not change1. Coal mining will also bring about the problem of water resource pollution, further exacerbating the degree of water scarcity. How to protect water resources and recycle them is a major challenge that China’s coal development has been facing for a long time2. The water storage technology of underground coal mine reservoirs has become one of the important ways for the coordinated development of coal resource mining and water resource protection in the western mining areas of China3,4. The mechanical strength and deformation and failure characteristics of rock pillars are the decisive factors for the stability of underground coal mine reservoirs5,6,7. During the long-term immersion process of underground reservoirs, the change in the water content of the surrounding rock inside the reservoir will cause damage and deformation to it and reduce its bearing capacity, seriously affecting the stability of the coal pillar dam body8,9,10. Therefore, studying the dynamic mechanical properties of rocks has important theoretical significance and practical guiding significance for improving the stability of water-bearing rocks and ensuring the safety of underground coal mine reservoirs.
As a naturally formed pore material, sandstone is one of the most common types of rock in engineering projects. There have been many studies on the mechanical properties of sandstone. Yang studied the mechanical properties of sandstone under repeated impact loads with a Hopkinson pressure bar and found that the confining pressure can inhibit the expansion of internal fissures within a certain range. A damage factor describing the effect of dynamic weakening is proposed. For sandstone with initial dynamic damage, its uniaxial compressive strength gradually decreases with the increase of the damage factor. With the increase of the damage factor, the failure mode develops from local damage to overall damage, and from split damage to shear slip damage11. In order to analyze the impact of periodic impact loads in underground space on the surrounding rock, Wang selected hollow cylinders and complete sandstone samples to conduct dynamic compression tests under different pressures. The results show that the hollow cylindrical sandstone exhibits lower dynamic strength and larger critical stress under radial gradient stress, and its failure modes are mainly tensile failure and local shear failure12. Teng analyzed the mechanical and acoustic emission characteristics of dry and water-saturated sandstone at different compression rates. Based on the deformation rate enhancing and the moisture softening factors of rock’s elasticity modulus, a one-dimensional constitutive model was proposed and validated by experimental results. The proposed one-dimensional constitutive model can describe the deformation characteristics of dry sandstone and water-saturated sandstone under different compression ratios13,14,15,16. In order to study the law of energy evolution during rock failure at different buried depths, Peng conducted a static uniaxial compression test and a dynamic impact test under different strain rates and different confining pressures. The results show that in the uniaxial compression test, the dissipation energy and dissipation rate of the rock show a quadratic curve with the increase of depth. In the dynamic load impact test, the incident energy, transmitted energy, dissipation energy and absorption energy increase with the increase of strain rate and confining pressure17. Brantut conducted triaxial deformation tests under constant strain rate and constant stress (creep) conditions on three kinds of sandstones, and found that the relationship between the microstructure state and the inelastic axial strain is independent of time. He studied a unified framework for quantifying rate-dependent deformation in fracture fields and established a link between microscopic time-dependent crack growth processes and macroscopic observed rates18. However, most researches on the dynamic mechanical properties of rocks have focused on the use of Hopkinson pressure bar for experiments19,20,21, most of them selected the high strain rate range (above 101). On the contrary, there are few studies on low and medium strain rates. There have been many studies on the mechanical properties of rock under dynamic load, but in engineering practice, sandstone is also affected by water, and the mechanical properties of water-saturated sandstone differ greatly from dry sandstone. Dubey studied the influence of the pH value of the solution on the sandstone samples, and conducted a deformation test on the water-bearing sandstone samples on a closed-loop servo-controlled automatic feedback material testing system. Experimental studies have shown that the compressive strength, tensile strength, shear strength and bond strength of sandstone increase with the increase of the pH value of water, while the friction angle decreases with the increase of the pH value of the saturated medium22. Gu studied the dynamic response of sandstone porosity and water volume. Four different types of sandstones are used, selected according to microscopic analysis, and are tested and analyzed by experiments. The results show that the influence of water saturation on the dynamic mechanical properties of sandstone is significantly affected by porosity, and the degree of weakening of sandstone by water saturation is positively correlated with porosity. This is attributed to the influence of pore water pressure and the Stefan effect between the fracture surface and water on the initiation and propagation of fractures. In addition, a dynamic mechanical model was further established, and the model was used to explore the influence mechanism of porosity on the dynamic behavior of water-bearing sandstone23. Liu conducted uniaxial compression tests on frozen sandstone, and studied the effects of temperature and water content on the uniaxial compressive strength. The results show that the compressive strength of water-saturated sandstone increases linearly with the decrease of temperature. With the increase of water content, the growth rate of compressive strength first increases and then decreases. In addition, X-ray and CT(Computed Tomography) scans were performed to elucidate the changes in the macroscopic mechanical strength of frozen sandstone. Therefore, studying the influence of water on sandstone is also an important topic24. However, the current impact of water on sandstone is mainly concentrated in quasi-static and dynamic loads at high strain rates25,26,27.
What’s more, there is a lack of research on how the water content of sandstone is affected28. Therefore, this article starts with the low and medium strain rate (10−1 ~ 101) and uses the drop hammer impact device to study the mechanical properties of sandstone under different water contents29.This paper holds substantial significance in the ___domain of investigating the stability of the surrounding rock of coal mine underground reservoirs30, and it can provide theoretical guidance for the study of the stability of the surrounding rock of coal mine underground reservoirs.
Rock samples preparation and test procedure
First, two kinds of sandstones with different water contents were prepared, and then the impact load test was carried out by using a drop-hammer impact testing machine. The whole process of specimen failure was monitored by force sensor and dynamic strain gauge. Finally, a sieve machine is used to screen the particle size of the broken sample.
Preparation of rock samples
Sandstones used in the experiment include coarse sandstone and fine sandstone. The main components are SiO2 and Al2Si2O5(OH)4, and the XRD (X-ray diffraction) analysis is as shown in Fig. 1. The grain size of the fine sandstone is 24 nm, and that of the coarse sandstone is 42 nm.

XRD pattern.
The basic information of the sandstones is listed in Table 1. The two sandstones are processed in strict accordance with the recommended method of international rock mechanics experiment (GB/T 23,561.1–2009). The sample is a complete and uniform cylinder with a diameter of 50 mm and a height of 100 mm. The two end faces of the sample are polished with a grinder to make the parallelism of the end faces within 0.05 mm and the flatness within 0.02 mm. The prepared samples were put into the oven for drying, and the drying temperature was set at 105℃ until the sample mass change was not greater than 0.01 g31. At this time, the sample mass is M1, that is, the completely dry mass. Put the dried sample into a vacuum water saturator, set the vacuum degree to − 0.095 MPa, and then water the sandstone in a near vacuum state for 24 h, so that the sample reaches a stable water content to obtain the saturated sample, and record the mass of the saturated sample as M2. One saturated sample of the coarse sandstone and the fine sandstone is selected respectively, which is put into a drying box for drying, and the drying temperature is set at 105℃. Record the mass M3 at suitable drying time interval. Get the relative moisture content \(\rho\) after drying for a certain time, and finally get the drying curve as shown in Fig. 2. Sample relative moisture content ρ can be calculated according to the following formula:

Drying curve.
In the formula: M1 is the dry mass of the sample, M2 is the mass of the sample saturated with water, and M3 is the mass of the sample soaked for i hours. It can be seen from Eq. (1) that the sample is 100% saturated when it is saturated with water.
The relative water content of the coarse sandstone and the fine sandstone shows a negative exponential trend with time, and the relative water content of fine sandstone is always higher than that of coarse sandstone under the same drying time. This is because the temperature of the outer surface is higher than that of the inner core of rock due to the thermal conductivity of rock, and the moisture in the outer layer is more easily evaporated by heat and discharged from the pores. Fine sandstone has less porosity than coarse sandstone, so it is more difficult for water molecules to evaporate out of the pores for the same drying time.
Experimental procedure
The specific steps of the experiment are shown below.
-
1.
Prepare samples with a relative water content of 16.7%, 33.3%, 66.7%, and 100% according to 2.1, and attach strain gauges on the sides of the samples. Select two-way strain gauges to record axial and radial strains respectively, and take the axial strain as code A and the radial strain as code R.
-
2.
The test is carried out on the drop hammer impact test bench, as shown in Fig. 3. The sample is directly placed on the impact table, and the impact quality is controlled by the weight. The hammerhead is raised to the specified height through the lifting guide rail, and then the upper clamp is released. The hammerhead can freely fall to impact the sample, and the force sensor records the time-force curve from the time when the hammerhead contacts the sample to the complete failure of the sample. A dynamic strain gauge (DH5922N) is used to record the time-strain curve from the beginning of the deformation to the final failure.
Fig. 3 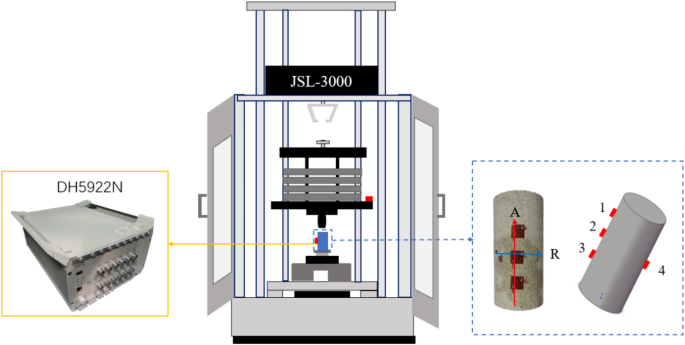
Drop hammer impact testing machine.
-
3.
After the destruction of the specimens, a sieving machine was used to sieve the destroyed specimens. The mass of particles under each particle size range was also recorded.

Results and discussion
Variations in impact force
For example, Fig. 4a is the force–time curve of coarse sandstone, and the force first rises in the form of concave, and then rises to the first peak and drops briefly. The sandstone sample has crack growth or initiation, so there is a slight decline. Then it continued to rise to the second peak, and the second fracture appeared. After reaching the highest peak, the force will begin to decline, and the descending process is smoother than the ascending process. Fluctuations occur when the curve falls to the bottom. The force changes with time as a whole in a parabolic form, and the impact load reaches the peak first for the coarse sandstone with the water content of \(\rho\)=16.7%, and the peak time for other coarse sandstone with water content is about 1 ms. Compared with the whole impact process, coarse sandstone with ρ = 16.7% has the shortest impact time and coarse sandstone with ρ = 100% has the longest impact time. Moreover, the peak value of impact load of all treated coarse sandstone samples is smaller than that of natural coarse sandstone. For example, Fig. 5b is the force–time curve of fine sandstone, and the impact load of ρ = 16.7% fine sandstone reaches its peak first, and the impact load of ρ = 100% fine sandstone reaches its peak last. Compared with the natural fine sandstone, the peak impact load and impact time of the treated fine sandstone are smaller than those of the natural fine sandstone. There are many peaks in the whole impact process, and the higher the water content, the smaller the first peak of coarse sandstone. The first peak of fine sandstone is less affected by water content. Compared with coarse sandstone and fine sandstone, the force–time curve of fine sandstone is steeper, and the peak value of force is generally higher than that of coarse sandstone, and the change degree of fine sandstone under different saturation is smaller than that of coarse sandstone.

Force–time curves for different water contents of Coarse (a) and Fine (b) sandstone.

The strain–time of different moisture content of coarse sandstone: (a) ρ = 16.7%, (b) ρ = 33.3%, (c) ρ = 66.7%, (d) ρ = 100%
Variations in surface strain
In the process of impact, sandstone will be broken, which will lead to cracks in the local position where the strain gauge is located, resulting in the strain gauge signal exceeding the range. At the same time, the local position will fall off and the strain gauge cannot receive the signal. Read the data from strain gauges that are not out of range and have signals, then obtain the strain rate curves of coarse sandstone and fine sandstone under different water contents, as shown in Figs. 5 and 6. It can be seen from the figure that during the impact process, the strain of coarse sandstone and fine sandstone can be divided into three stages, one is the strain fluctuation stage, in which the strain fluctuates up and down with time, and the fluctuation amplitude of radial strain is larger than that of axial strain, and the strain is increasing as a whole. The second stage is the strain rising stage, the strain increases with time and the change rate is faster. The third stage is the strain decreasing stage, and the strain has not recovered to 0 at last, which proves that plastic strain occurs. According to the analysis of Figs. 4 and 6, with the increase of water saturation, the fluctuation amplitude of the first stage gradually decreases. Because with the increase of water saturation, the softening of sandstone is greater, and the brittleness of sandstone becomes weaker, so the brittle fracture is reduced.

The strain–time of different moisture content of fine sandstone: (a) ρ = 16.7%, (b) ρ = 33.3%, (c) ρ = 66.7%, (d) ρ = 100%
Variations in dynamic mechanical parameters of sandstones with different moisture content
Figure 7 shows the curves of time-force, time-displacement, time-strain and time-energy of coarse sandstone in natural state. The velocity, displacement and dissipation energy of impactor can be calculated by formulas (2), (3) and (4)32.
where \(V(t),V_{i} ,F\left( t \right),X(t),X_{i} ,E(t),m,g,t\) are instantaneous velocity, initial velocity, instantaneous force, displacement, initial displacement, dissipated energy, mass, acceleration and time of impact head. The initial time is the time when the impact head contact the upper surface of the sample. It can be seen from the figure that the speed has been decreasing with time, and the change of speed is slow first, then fast and finally tends to be flat. Displacement increases with time and changes gradually gently. The dissipation energy of impact head (the total energy absorbed by sandstone), has been increasing with time, and the change is slow at first, then fast and finally tends to be gentle.

Force/velocity/displacement/energy-time curves.
By formulas (2), (3) and (4), the peak of force, peak of displacement and peak of total absorbed energy of sandstone samples with different relative water content can be obtained. The dynamic strength and global strain peaks of sandstone can be obtained from formulas (5) and (6).
where F is the instantaneous force, X is the displacement, A is the cross-sectional area of the sandstone sample, and L is the height of the sandstone sample. The fitting curves of the variation characteristics of dynamic strength, peak strain and total absorbed energy of coarse and fine sandstones with different water contents are shown in Fig. 8. It can be seen from the figure that the dynamic strength of coarse sandstone and fine sandstone decreases with the increase of water content, and the dynamic strength of coarse sandstone decreases more. The linear fitting of the function relationship between water content and dynamic height shows a good linear decreasing relationship. Meanwhile, the degree of dispersion of the dynamic strength of coarse sandstone is higher than that of fine sandstone, but the overall dynamic strength of coarse sandstone is lower than that of fine sandstone. The peak strain of coarse sandstone and fine sandstone increases with the increase of water content, and the increase of coarse sandstone is larger. The linear fitting of the function relationship between moisture content and strain peak showed a good linear increasing relationship. The total energy absorbed by fine-grained sandstone during the impact process increases with the increase of water content, while the total energy absorbed by coarse-grained sandstone during the impact process has little change, and water content has little influence on it. The linear fitting of the function relationship between water content and total absorbed energy shows a good linear increasing relationship. The variation of peak strain with water content for coarse sandstone and fine sandstone is shown in Fig. 9.The axial strains of coarse sandstone and fine sandstone both have an obvious increasing trend with water content, but the radial strain of coarse sandstone almost does not change with water content. The radial strain of fine sandstone decreases slightly with the increase of water content. The above conclusions indicate that the softening effect of water on sandstone is not isotropic under impact load. Under the impact load, the softening effect of water on sandstone is mainly reflected in the direction of the impact load.

Fitting curves of the mechanical properties of coarse and fine sandstones with different water contents: Dynamic strength (a), Peak strain (b), Total absorbed energy (c).

Peak strain of coarse (a) and fine (b) sandstone with different water contents.
Particle size analysis
Collect and classify the debris of each rock specimen after the drop impact test at different water contents, as shown in Fig. 10. The crushed stones larger than 40 mm are mainly composed of conical crushed stones in the upper and lower parts and flaky peeled crushed stones containing the cylindrical cambered surface of the sample. The gravel larger than 8 mm and less than 40 mm is mainly composed of small pieces of gravel. These pieces of gravel are mainly small pieces of gravel that fall off the rock surface in the process of cracking caused by the compression of sandstone samples. The gravel smaller than 8 mm is the powdery gravel produced during the impact process of the sandstone sample. Water increases the number of sandstone failure blocks. The collected gravel was screened to obtain the fragment grading curve of sandstone with different water contents, as shown in Fig. 10. The whole grading curve of coarse sandstone is presented in two sections, with 12.5 mm as the turning point, and the fragment larger than 12.5 mm accounts for more than 50% of the whole. In this section, the mass proportion changes sharply with the grain size, and the fragment smaller than 12.5 mm has a uniform proportion of all parts. Fine sandstone gradation curve also presents a two-stage pattern, but the turning point of fine sandstone gradation curve is advanced to 40 mm. The failure mode of sandstone samples under impact load is mainly "X" shear failure, so the largest proportion is the upper and lower conical gravels. The minor failure form of sandstone is the micro-fracture produced in the impact process. The micro-fracture initiation and development in the impact process result in small pieces of gravel.

The morphological characteristics of rock specimen debris with different water contents.
Ignoring the difference in relative density and shape between sandstone particles of different sizes, fractal model can be used to calculate the fractal dimension of sandstone after crushing33.
where \(\delta\) is the size describing the particle size, mm.\(m(\delta <{d}_{i})\) is the cumulative mass of particles with smaller particle size, g. \({m}_{T}\) is the total mass of sandstone ,g. \({d}_{m}\) is the maximum particle size after crushing. \(D\) is the fractal dimension, respectively. Take the logarithm of both sides of formulas (7) to get:
Variation law of grading curve of coarse and fine sandstone debris under different water content is displayed in Fig. 11. According to formulas (8), if we take \(\ln (m\left( {\delta < d_{i} } \right)/m_{T} )\) as the vertical coordinate and \(\ln (d_{i} /d_{m} )\) as the horizontal coordinate, then the slope is 3-D, as shown in Fig. 12. Finally, the fractal dimension of coarse sandstone and fine sandstone with different water contents is obtained as shown in Fig. 13. The variation of fragmentation fractal dimension of sandstone with water content is a quadratic curve. The variation of fragmentation fractal dimension of coarse sandstone with water content is smaller, but the fragmentation fractal dimension of the coarse sandstone is always higher than that of the fine sandstone.

Variation law of grading curve of coarse (a) and fine (b) sandstone debris under different water content.

Fractal dimension of coarse (a) and fine (b) sandstone with different water contents.

Variation of fracture fractal dimension of coarse and fine sandstone with different water content.
Underlying mechanism of dynamic mechanical behaviors of sandstone with different moisture content
Sandstone is a kind of natural porous material and consists of cemented minerals and particles, inherently harboring primary fractures within its structure. When subjected to stress, the deformation process of sandstone can be delineated into three distinct stages: the initial compaction stage, followed by the elastic stage, and culminating in the plastic stage34. Under natural conditions, the elastic stage of sandstone persists for the longest duration, whereas its plastic stage remains relatively inconspicuous. Notably, the presence of water within sandstone serves to augment its plasticity and induce softening. Moreover, coarse sandstone, characterized by a larger porosity, is more acutely influenced by the presence of water.
In this paper, drawing upon the intricate microstructure of sandstone, we undertook a simplification process, reducing it to a two-dimensional representation, as vividly illustrated in Fig. 14a. When water permeates the fractures and pores of sandstone, the water-saturated pores establish connections with the external environment via minute fractures. Consequently, the sandstone undergoes a transformation into a multiphase medium, comprising both water and the sandstone skeletal framework, as clearly depicted in Fig. 14b.Under static loading conditions, as fractures gradually expand, the water initially residing within the original fractures will migrate and fill the newly formed fractures. Nevertheless, when the sandstone is subjected to dynamic loading, given that the flow velocity and deformation rate of water are lower than those of the sample itself, water manifests within the fractures in the form of equivalent stress35.Consequently, the deformation of the sandstone skeletal structure is predominantly governed by the equivalent stress engendered by the combined action of dynamic loading and water. Evidently, the higher the water content, the more pronounced the influence of the water-induced equivalent stress on the sandstone sample. Furthermore, due to the inherent disparity in porosity between coarse-grained sandstone and fine-grained sandstone, the efficacies of the water equivalent stress exhibit notable variations.

The structural effective stress analysis of water-saturated sandstone36.
As shown in Fig. 15, two parallel, circular plates with radius r that are separated by a Newton liquid with viscosity k (Pa∙s) and thickness h. The force F required to pull the plates apart perpendicular to the direction of the plates at the speed of V is, and this is the Stefan effect34. This effect mainly exists in rocks under saturated water condition, while the Stefan effect is much less influential in dry rocks with less free water37.

Stefan effect38.
When sandstone is saturated with water, its micro-fracture gap is small, which shows that the parameter H is small. Therefore, the viscous resistance generated by Stefan effect is large, so the expansion of micro-fracture is affected. Macroscopically, the sandstone failure under saturated water condition is mainly a large crack failure under oblique shear, and its fracture fractal dimension is relatively small. It is shown in Fig. 13, and it can be seen from the Figure that fine sandstone with smaller porosity is more influenced by Stefan, its h is smaller, and its viscous damping is larger. Macroscopically, its crushing fractal dimension decreases more sharply.
Conclusions
In this paper, free fall impact experiments are carried out and particle size analysis is carried out to explore the influence of water content on the mechanical properties of coarse and fine sandstone. The research results can provide theoretical guidance for the study on the stability of surrounding rock of underground coal mine reservoirs. The main conclusions are summarized as follows:
-
1.
Water will weaken and soften sandstone, reducing the compressive strength of sandstone, and the higher the water content, the lower the dynamic strength and the greater the plastic deformation of sandstone. Coarse sandstone with larger porosity is softened more obviously by water and its dynamic strength decreases more greatly.
-
2.
The weakening effect of water on sandstone is mainly manifested as the effect of equivalent stress. Due to the incompressibility of water, in the process of rock compression, internal cracks close under pressure, and water pressure produces a trend of movement from the middle part of the crack to the crack tip, resulting in concentrated tensile stress at the crack tip, which leads to accelerated crack growth, and macroscopically, the bearing capacity is reduced. And this weakening effect has obvious correlation with water content.
-
3.
In the saturated sandstone, the crack propagation of sandstone is also affected by Stefan effect, and the propagation of micro-cracks is limited by the viscous resistance due to the influence of Stefan effect. Macroscopically, the fracture degree is reduced, and the smaller the porosity is, the greater the viscous resistance is, and the greater the fracture degree is decreased. However, due to the low strain rate, its viscous damping is limited and its influence on large fractures is limited. Therefore, the compressive strength of the whole sandstone is mainly weakened.
Data availability
The data used to support the findings of this study are included within the article.
References
Zhang, C. et al. Research on the capacity of underground reservoirs in coal mines to protect the groundwater resources: A case of Zhangshuanglou Coal Mine in Xuzhou, China. Water 15, 1468 (2023).
Chen, Z. et al. Reasonable size design and influencing factors analysis of the coal pillar dam of an underground reservoir in Daliuta Mine. Processes 11, 2006 (2023).
Zhang, Y. et al. Seismic safety analysis of interlaminar rock mass in the distributed underground reservoir of a coal mine. Water 16, 366 (2024).
Zou, Q. L. et al. Effect of water-based SiO2 nanofluid on surface wettability of raw coal. Energy. 254, 124228 (2022).
Feng, F. et al. Effects of external dynamic disturbances and structural plane on rock fracturing around deep underground cavern. Int. J. Coal Sci. Technol. 9, 15 (2022).
Huang, S. B. et al. Experimental investigation and prediction model for UCS loss of unsaturated sandstones under freeze-thaw action. Int. J. Min. Sci. Technol. 32(1), 41–49 (2022).
Dou, L. T. et al. Fracture behavior and acoustic emission characteristics of sandstone samples with inclined precracks. Int. J. Coal Sci. Technol. 8(1), 77–87 (2021).
Kim, B. H. et al. Investigation of the anisotropic confinement-dependent brittleness of a Utah coal. Int. J. Coal Sci. Technol. 8(2), 274–290 (2021).
Fan, L. et al. Respirable nano-particulate generations and their pathogenesis in mining workplaces: A review. Int. J. Coal Sci. Technol. 8(2), 179–198 (2021).
Zhang, T. et al. Experimental and numerical investigations on the tensile mechanical behavior of marbles containing dynamic damage. Int. J. Min. Sci. Technol. 32(1), 89–102 (2022).
Yu, Y. et al. Damage of sandstone induced by repetitive impact loading. Int. J. Geomech. 20(7), 04020090 (2020).
Wang, S. M. et al. Dynamic failure properties of sandstone under radial gradient stress and cyclical impact loading. Front. Earth Sci. Switz. 7, 251 (2019).
Teng, T. et al. Experimental and theoretical study on the compression characteristics of dry/water-saturated sandstone under different deformation rates. Arab. J. Geosci. 13, 517 (2020).
Ma, T. F. et al. Damage evolution characteristics and deterioration mechanism of mechanical properties of sandstone subjected to drying-wetting cycles. J. Mater. Res. Technol. 23, 4591–4605 (2023).
Ran, Q. C. et al. Experimental investigation on mechanical characteristics of red sandstone under graded cyclic loading and its inspirations for stability of overlying strata. Geomech. Geophys. Geogr. 9(1), 11 (2023).
Zou, Q. L. et al. Evaluation and intelligent deployment of coal and coalbed methane coupling coordinated exploitation based on Bayesian network and cuckoo search. Int. J. Min. Sci. Technol. 32(6), 1315–1328 (2022).
Peng, K. et al. Mechanical property of granite from different buried depths under uniaxial compression and dynamic impact: An energy-based investigation. Powder Technol. 362, 729–744 (2020).
Brantut, N. et al. Rate- and strain-dependent brittle deformation of rocks. J. Geophys. Res. Sol. Ea. 119, 1818–1836 (2014).
Li, Q. W. et al. Dynamic analysis and criterion evaluation on rockburst considering the fractured dissipative energy. Adv Mech Eng. 11(3), 1687814019825906 (2019).
Li, X. B. et al. Dynamic characteristics of granite subjected to intermediate loading rate. Rock Mech. Rock Eng. 38, 21–39 (2005).
Zhang, Z. X. et al. Effects of loading rate on rock fracture: Fracture characteristics and energy partitioning. Int. J. Rock Mech. Min. 37, 745–762 (2000).
Dubey, R. K. et al. Influence of pH of water on mechanical properties of sandstone—An experimental approach. J. Sci. Ind. Res. India 59, 583–586 (2000).
Gu, H. L. et al. Dynamic response and meso-deterioration mechanism of water-saturated sandstone under different porosities. Measurement 167, 108275 (2021).
Liu, B. et al. Effect of water content on mechanical and electrical characteristics of the water-rich sandstone during freezing. Environ. Earth Sci. 79, 236 (2020).
Celik, M. Y. et al. The influence of the water saturation on the strength of volcanic tuffs used as building stones. Environ. Earth Sci. 74, 3223–3239 (2015).
Lu, Y. L. et al. Experimental study of the influence of water and temperature on the mechanical behavior of mudstone and sandstone. B Eng. Geol. Environ. 76, 645–660 (2017).
Tang, S. B. The effects of water on the strength of black sandstone in a brittle regime. Eng. Geol. 239, 167–178 (2018).
Zhou, Z. L. et al. Influence of water content on mechanical properties of rock in both saturation and drying processes. Rock Mech. Rock Eng. 49, 3009–3025 (2016).
Shah, S. Z. H. et al. Impact resistance and damage tolerance of fiber reinforced composites. Compos. Struct. 217, 100–121 (2019).
Wang, X. P. et al. Mechanical properties and damage modeling of unloaded marble under freezing and thawing with different temperature ranges. Cold Regions Sci. Technol. 218, 104100 (2024).
Zhang, J. et al. Efficient and tunable phosphorescence of new platinum(II) complexes based on the donor–π–acceptor Schiff bases. J. Photochem. Photobiol. A 316, 12–18 (2016).
Rossi, P. A physical phenomenon which can explain the mechanical behaviour of concrete under high strain rates. Mater. Struct. 24, 422–424 (1991).
Zheng, D. et al. An explanation for rate effect of concrete strength based on fracture toughness including free water viscosity. Eng. Fract. Mech. 71, 2319–2327 (2004).
Zhang, H. B. et al. Study on the mechanical properties of unloading damaged sandstone under cyclic loading and unloading. Sci. Rep. 13(1), 7370 (2023).
Zhou, J. et al. Proposing a novel comprehensive evaluation model for the coal burst liability in underground coal mines considering uncertainty factors. Int. J. Min. Sci. Technol. 31(5), 799–812 (2021).
Yin, S. et al. Experimental study on the infrared precursor characteristics of gas-bearing coal failure under loading. Int. J. Min. Sci. Technol. 31(5), 901–912 (2021).
Tu, Q. Y. et al. Energy-limiting factor for coal and gas outburst occurrence in intact coal seam. Int. J. Min. Sci. Technol. 31(4), 729–742 (2021).
Yu, M. L. et al. Investigation on fracture models and ground pressure distribution of thick hard rock strata including weak interlayer. Int. J. Min. Sci. Technol. 32(1), 137–153 (2022).
Acknowledgements
This work is financially supported by the Open Fund of State Key Laboratory of Water Resource Protection and Utilization in Coal Mining (Grant No. GJNY-20-113-01); and the National Natural Science Foundation of China (Grant No.52404109), which are gratefully acknowledged.
Author information
Ethics declarations
Competing interests
The authors declare no competing interests.
Consent for publication
All authors approved the final manuscript and the submission to this journal.
Additional information
Publisher’s note
Springer Nature remains neutral with regard to jurisdictional claims in published maps and institutional affiliations.
Rights and permissions
Open Access This article is licensed under a Creative Commons Attribution-NonCommercial-NoDerivatives 4.0 International License, which permits any non-commercial use, sharing, distribution and reproduction in any medium or format, as long as you give appropriate credit to the original author(s) and the source, provide a link to the Creative Commons licence, and indicate if you modified the licensed material. You do not have permission under this licence to share adapted material derived from this article or parts of it. The images or other third party material in this article are included in the article’s Creative Commons licence, unless indicated otherwise in a credit line to the material. If material is not included in the article’s Creative Commons licence and your intended use is not permitted by statutory regulation or exceeds the permitted use, you will need to obtain permission directly from the copyright holder. To view a copy of this licence, visit http://creativecommons.org/licenses/by-nc-nd/4.0/.
About this article

Cite this article
Kong, F., Li, X., Peng, X. et al. Underlying mechanism behind the dynamic mechanical behavior of sandstone with varying moisture content under medium speed impact. Sci Rep 15, 5700 (2025). https://doi.org/10.1038/s41598-025-89992-0
Received:
Accepted:
Published:
DOI: https://doi.org/10.1038/s41598-025-89992-0
