
Abstract
Typically found in rare-metal granites and pegmatites, lithium micas are increasingly considered a resource for lithium as global demand surges. In a recently discovered major lithium resource within the Macusani Volcanic Field in Peru, lithium mica crystal clasts hosted by a tuffaceous mudstone represent an important ore constituent. The mm-scale mica clasts comprise a zinnwaldite core and a lepidolite rim. Compositionally similar to micas in global peraluminous, rare-metal-rich leucogranites and LCT pegmatites, they exhibit enrichment in incompatible, fluid-mobile lithophile elements relative to micas in other volcanogenic and intrusive units in the Macusani Volcanic Field. The compositions of the mica crystal clasts record high degrees of magmatic differentiation and exsolution of a magmatic vapor phase during their crystallization in a ligand-rich, peraluminous crystal mush. 40Ar/39Ar dating of zinnwaldite-lepidolite crystal clasts reveals cooling between 8823 ± 9 and 8717 ± 44 ka, coinciding with a regional magmatic lull in the Central Andes of southern Peru. A general slowdown in magmatic activity and a hiatus in volcanism may have contributed to extreme differentiation and pre-eruptive volatile build-up. This study provides crucial insights for lithium exploration, highlighting volcanogenic-sedimentary lithium mica deposits as a promising exploration target in peraluminous volcanic fields.
Introduction
The Neogene Macusani Volcanic Field in Peru stands as a natural laboratory for understanding peraluminous magmatism and rare-metal enrichment processes. Since the discovery of ‘macusanite’—a rhyolitic glass highly enriched in lithophile elements (Li > 2000 ppm)—in the 1920s1,2,3,4,5, this area has attracted considerable scientific interest. In addition to macusanite, the volcanic field features diverse magmatic products derived from strongly peraluminous silicic magmas with unusually high concentrations of fluxing elements (F, B, P)6,7,8. Unlike typical rare-metal leucogranites, Macusani magmas reached the surface, producing pyroclastic mega-eruptions4,9,10,11. Macusani has served as an exceptional natural laboratory to study magmatic processes. For example, London et al.5 selected macusanite to investigate “melt-vapor solubilities and elemental partitioning in peraluminous granite-pegmatite systems”, while Pichavant et al.12 employed the Macusani volcanic rocks to study trace element partitioning in “strongly peraluminous rare-metal silicic magmas”.
The area has gained renewed attention due to the global demand for lithium resources. In 2017, a significant lithium resource (0.9 Mt Li) was identified in the Falchani Lithium Project in the central part of the volcanic field13 (Figs. 1, S1). This resource occurs primarily within the so-called Lithium-rich Tuff—a previously uncatalogued tuffaceous mudstone within the late-Miocene Macusani Formation—where lithium micas constitute important ore minerals14.
The presence of lithium mica crystal clasts with compositions resembling those of micas in peraluminous, rare-metal-rich leucogranites and Li-Cs-Ta (LCT) pegmatites within a tuffaceous mudstone raises fundamental questions about their genesis. To our knowledge, this represents the first documented occurrence of lithium micas in volcanogenic sedimentary rocks, marking a significant advance in understanding potential lithium mineralization environments. In this study, we employ a multi-analytical approach combining petrographic analysis, in-situ geochemical characterization, and 40Ar/39Ar age determinations of these lithium mica crystal clasts to constrain their formation processes and provide insights into novel lithium exploration targets in volcanogenic sedimentary settings.

Simplified geological map of the Macusani Volcanic Field and adjacent areas in the Eastern Cordillera. This is an original map created using QGIS 3.40 (https://qgis.org) incorporating geological information from15,16,17,18 as well as our own field observations. The ___location of samples analyzed in this and previous studies 4,6,9,10,11,15,1920,21,22,23 is indicated. Our 40Ar/39Ar dates are shown in bold. Dotted patterns indicate intrusive rocks. The shaded relief map (background) was generated from a digital elevation model obtained from the Alaska Satellite Facility Data Search Vertex website (https://search.asf.alaska.edu/#/).
Geological setting
The Neogene Macusani Volcanic Field is located in the Eastern Cordillera of the Central Andes in southeastern Peru11. In southern Peru, the Eastern Cordillera exposes an exhumed west-verging fold-thrust belt involving Paleozoic and Mesozoic strata24,25,26,27,28. Thermochronological data29,30 show that major shortening and crustal thickening of the Eastern Cordillera occurred since the Late Miocene.
The Macusani Volcanic Field covers an approximate area of ∼1,300 km2 (Fig. 1) at an elevation of 4,400 m.a.s.l. It is the northernmost of a series of Cenozoic volcanic fields located in the NW-trending Macusani Structural Zone28,29 that lies between the Cordillera de Carabaya to the northeast and the Central Andean Backthrust Belt to the southwest (Fig. 1). The Macusani Volcanic Field also represents the northernmost expression of the Neogene Ignimbrite Province of the Central Andes in the so-called rear or inner arc running along the Eastern Cordillera and Puna-Altiplano plateau31.
In the Macusani Volcanic Field, Tertiary extrusive rocks include subordinate exposures of Oligocene-Miocene rhyodacitic tuff and basaltic andesite of the Picotani Group, and volumetrically dominant rhyolitic rocks of the Macusani Formation, the youngest formation of the middle- to late-Miocene Quenamari Group15 (Fig. S2A). Small silicic stocks and dikes of the Quenamari and Picotani intrusive suites are petrographically similar to and largely coeval with the homonymous volcanogenic rocks15.
The Macusani Formation, which hosts the lithium-bearing unit studied, encompasses 250 to 450 m-thick, non-welded, poorly stratified, crystal-rich, rhyolitic pyroclastic flows of ash- and lapilli-sized fragments11. It is composed of strongly peraluminous silicic volcanic series related to S-type reduced magmas that are enriched in lithophile incompatible elements compared to average values in highly silicic igneous rocks7,10,12. 40Ar/39Ar biotite dates revealed two short eruptive episodes at 10 ± 1 and 7 ± 1 Ma11. López16 defines three intra-formational members separated by erosive unconformities within the Macusani Formation, which are, from older to younger, the Chacacuniza, Sapanuta, and Yapamayo members (Figs. 1, S1-S2B).
Lithium micas in a tuffaceous mudstone
The so-called Lithium-rich Tuff, which hosts the main lithium resources of the Falchani Lithium Project with contents ∼3000 ppm Li, is 50 to 140 m thick (Fig. S2C). It is interpreted to have been deposited subaerially in a lacustrine environment13. The Lithium-rich Tuff shows a variety of structures including fine, often slumped, alternating white and pale cream and gray laminations of millimeter scale, as well as nodular, porous, brecciated, and massive layers (Figs. 2A, S3). Rocks in this unit are probably best described as tuffaceous mudstone, as they are a mud-grade volcaniclastic rocks derived from rapid syn-eruptive resedimentation of texturally unmodified, freshly erupted pyroclastic particles constituting more than 90% of the rock volume32.

Aspects of the Lithium-rich Tuff and lithium mica crystal clasts hosted therein. (A) Photograph of a typical rock sample from this unit. (B) Medium to coarse ash-sized, dark brown to black mica crystal clasts stand out against the pale tuffaceous mudstone background. (C-F) SEM backscattered electron (SEM-BSE) images of a mica crystal clast embedded in a very fine-grained matrix. Abbreviations33: Cldn—“chalcedony”; Afs—alkali feldspar; Kln—kaolinite; Mca—mica; Lpd—lepidolite; Tpz—topaz; Znw—zinnwaldite; Zrn—zircon.
Mica crystal clasts are dark brown to black in hand specimen and range in size from 0.5 to 2 mm. They are usually oriented with (001) planes parallel to the rock lamination, although larger crystal clasts may disrupt the laminations and be enclosed in sag structures (Fig. 2B). The crystal clasts are embedded in a very fine-grained matrix composed mostly of alkali feldspar, quartz, lepidolite, “chalcedony” (which at the micro- and nano-scale is comprised of polycrystalline quartz, cristobalite/opal-C, and amorphous silica/opal-A), kaolinite, and lesser amounts of topaz (Figs. 2C-F and 3A). The modal proportion of mica crystal clasts in the tuffaceous mudstone is between ~ 1 and 2 vol% in most of the samples, which makes them implausible to account for the ~ 3,000 ppm Li in bulk analyses of the same rocks. Lithium micas in the matrix are probably also important Li carriers, potentially contributing more to the final Li grades than the mica crystal clasts. The matrix displays heterogeneous textures, with domains of varying crystallinity and compaction, and a complex intergrowth of cryptocrystalline to microcrystalline phases with relict vitroclastic textures (Fig. 2D) suggesting partial devitrification of original volcanic glass. The matrix shows evidence of hydrothermal alteration, indicated by the development of secondary silica phases and kaolinite, which fills most original pore spaces. TEM images reveal fine intergrowths between mica and alkali feldspar and kaolinite replacement of mica crystals along cleavage planes (Figs. 4A, S6). The lattice-fringe images and electron diffraction patterns reveal the 2M polytype (Fig. 4B-C).
Some mica crystal clasts in the Lithium-rich Tuff show well-defined rims a few tens of microns thick, which are darker than the corresponding crystal cores in backscattered electron SEM (BSE-SEM) images (Figs. 3B, S4). The contact between the rim and the core is planar and sharp. The darker rim is distinctively corroded along the outer boundaries. The X-ray element maps show that the rims are enriched in Si, Rb, and F and depleted in Fe, Mg, and Ti compared to the cores (Figs. 3C-I, S4). Compositionally, the mica cores can be classified as zinnwaldite (siderophyllite-polylithionite join) and the rims as lepidolite (trilithionite-polylithionite join; Fig. 5A-C, Tables S2-S4). The strong 705 cm− 1 band in micro-Raman spectra obtained in lepidolite rims (Fig. S5) is often observed in the lepidolite series, and in the trilithionite and polylithionite endmembers34. The lepidolite rims are systematically enriched in Li, F, Rb, Cs, Nb, Ta, Sn, W, Zr, and Hf, and depleted in Ba compared to the zinnwaldite cores (Fig. 6; Table S3). Lepidolites also have lower Nb/Ta and Zr/Hf ratios (1.75–3.13 and 4.10-13.95, respectively) than zinnwaldites (3.81–5.23 and 6.64–17.22; Fig. 6A).

SEM back-scattered electrons (SEM-BSE) images (A-B) and quantified X-ray maps generated by EPMA showing chemical zoning (C-I) in a mica crystal clast in a sample of Lithium-rich Tuff, with a zinnwaldite core and a narrow lepidolite rim. The locations of Raman analyses R1 and R2 provided in Fig. S5 are shown as green dots. Abbreviations33: Cldn—“chalcedony”; Kln—kaolinite; Mca—mica; Mnz—monazite; Zrn—zircon.

TEM observations on lepidolite from the Lithium-rich Tuff. (A) Low magnification HAADF image of lepidolite coexisting with alkali feldspar and partly replaced by kaolinite (see TEM-EDX maps of the same area in Fig. S6). (B) High resolution image with d001 spacings of 20.59 Å. (C) Electron diffraction pattern normal to < 110 > showing 20 Å spacing for (hhl), which identifies the polytype 2M of mica. (D-E) HAADF images of preserved and empty sub-micron inclusions. (F) TEM-EDX of a Cl-Cs-Mn-rich inclusion. (G-H) TEM-EDX maps for Cl, Cs, Mn, and Na of the same areas as in (D) and (E). Abbreviations33: Cldn—“chalcedony”; Afs—alkali feldspar; Kln—kaolinite; Lpd—lepidolite.
TEM examination of lepidolite reveals the ubiquitous occurrence of myriad submicron, polygonal, elongated, mineral inclusions or the voids left by them (Fig. 4D-E). Their long axes are oriented parallel to the mica cleavage. These features indicate that they are primary inclusions trapped during the crystal growth. TEM-EDX point analyses and maps show that the inclusions correspond to Cs(±Mn)Cl and NaCl salts (Figs. 4F-H, S7-S8).

Classification of micas from the Lithium-rich Tuff and other volcanic and intrusive rocks from the Macusani Volcanic Field (this study and6,10,12) in (A) Mg-Li–Fetot + Mn + Ti-VIAl binary diagram after35 and (B) Fe + Mg + Mn–Al–Li and (C) (CFe + Mg + Mn–Al–Li ternary diagrams after36. Lithium contents were measured by LA-ICP-MS, except for TEM-AEM measurements on lepidolite. For some literature data, Li values were calculated from EPMA measurements following35.

Composition of micas from the Lithium-rich Tuff and other volcanic and intrusive rocks from the Macusani Volcanic Field (this study and6,10,12) in Nb/Ta versus Zr/Hf (A), Li ((B), Rb (C), Cs (D), and W (E) plots. The composition of micas in peraluminous granites associated with rare metal deposits12,35,37,38,39,40,41,42,43 and LCT pegmatites44,45,46 in the literature is shown for comparison. Lithium contents were determined by LA-ICP-MS. Compositions of micas in rare metal deposits and LCT pegmatites in the literature are not shown in plot A due to general lack of Hf data.
Origin of the lithium mica clasts
The compositions of mica crystal clasts in the Lithium-rich Tuff from the Falchani Lithium Project contrast with those of mica crystals in other volcanogenic units, including ash flow tuff and obsidian glass (macusanite), and mica phenocrysts in granitic rocks from the Macusani Volcanic Field (Figs. 5 and 6, Tables S2-S4). Specifically, micas in the other magmatic units in Macusani broadly classify as siderophyllite-biotite and muscovite (Fig. 5). Furthermore, mica crystal clasts from the Lithium-rich Tuff, particularly lepidolite, are enriched in incompatible, fluid-mobile elements such as Li, Sn, W, Cs, and Rb, depleted in Ti and Ba, and exhibit lower Nb/Ta and Zr/Hf ratios relative to regional micas. This compositional signature closely resembles that of micas in strongly peraluminous, rare-metal-rich leucogranites and LCT pegmatites (Fig. 6).
Changes in the ratios of geochemical twin elements like Nb/Ta and Zr/Hf, which share a same charge and very similar radii, are particularly informative as they are relatively unaffected by processes of partial melting and normal degrees of igneous fractionation (i.e., CHARAC—CHArge-and-RAdius-Controlled—behavior;47). Thus, during ‘regular’ magmatic processes, these element pairs typically maintain their respective chondritic ratios. Low Nb/Ta (< 8) and Zr/Hf (< 25) values compared to chondrite meteorites (Nb/Ta: 17.6 ± 0.4 Zr/Hf: 36.3 ± 0.348) and CHARAC ranges (Nb/Ta: 11–19; Zr/Hf: 26–4647,49) in bulk analyses are attributed to extreme degrees of magmatic differentiation in polymerized, peraluminous melts50,51 and/or exsolution of ligand (e.g., F, B)-rich, acidic, and reduced magmatic fluids52. These are common features in rare-metal-rich peraluminous granitic rocks52,53 and micas thereof54,55,56. Therefore, the overall lower Nb/Ta and Zr/Hf in lithium micas from the Lithium-rich Tuff agree with higher degrees of differentiation and/or the exsolution of a magmatic volatile phase rich in ligands such as F as differential facts from other mica-bearing volcanogenic and intrusive units in the Macusani Volcanic Field. We contend that lithium mica crystal clasts in the Lithium-rich Tuff formed in the upper parts of a crystallizing, strongly evolved peraluminous crystal mush (cf57). In this context, the lepidolite rims, which show sharp contacts with the zinnwaldite cores and yielded the lowest Nb/Ta and Zr/Hf and the highest fluid-mobile element contents, probably record the exsolution of a magmatic fluid phase before the explosive eruption.
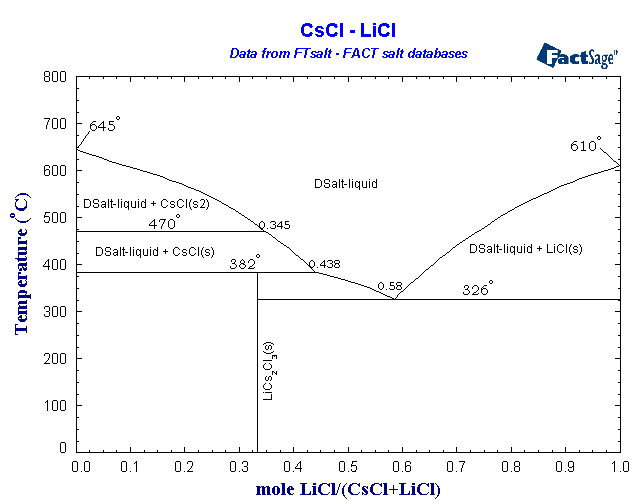
The occurrence of primary, monophase solid NaCl and CsCl inclusions in lepidolite is intriguing. In particular, natural inclusions of CsCl in minerals have not been previously reported in the literature. They could have resulted from the trapping of salt-saturated magmatic brines. However, this would have typically resulted in multi-phase inclusions including one or more fluid phases. The separate occurrence of NaCl and CsCl primary inclusions (Fig. 4G) also challenges this hypothesis. As an alternative, we propose that the inclusions might have formed from immiscible molten salts, which provide an explanation for the simultaneous formation of inclusions of different compositions and their monophase nature. The melting temperature of pure CsCl is 645 ºC under atmospheric pressure58, while molten salt mixtures exhibit substantially lower melting temperatures59 particularly in the binary CsCl-LiCl system, with a eutectic melting temperature of 326 ºC at LiCl/(CsCl + LiCl) of 0.5860. Such low melting temperatures suggest that CsCl salts and their mixtures could remain molten even in highly undercooled, metal-rich granitic magmas (e.g., LCT pegmatites: ∼515 ± 20 °C61). Molten salts inclusions have been recently documented in magmatic-hydrothermal systems such as magnetite-apatite62 and porphyry gold63 deposits. The molten salts hypothesis is consistent with the idea that lithium micas in the Lithium-rich Tuff formed at near-solidus temperatures in the apical portion of a crystallizing magma body with a coexistence of residual melts—including immiscible ionic melts—and probably also a magmatic-volatile phase, as suggested by64 for lithium mica compositions in rhyolitic melts.
Timing and tectonic significance of lithium mica formation
The 40Ar/39Ar incremental heating age determinations on mica crystal clasts range from 8978 ± 73 ka to 8717 ± 44 ka (Fig. 7; Tables S5-S13). Although the dated micas appeared homogeneous under binocular examination, exhibiting the dark-brown coloration characteristic of zinnwaldite, the presence of narrow lepidolite rims on some analyzed crystals cannot be completely ruled out. Consequently, the obtained ages may in some cases represent mixed analyses in which the zinnwaldite component is far more predominant. The oldest plateau date (sample 2021-MAC-048) does not overlap with plateau dates for the other samples of Lithium-rich Tuff (Fig. S9). The age difference (261 ± 85 ka) cannot be explained in terms of stratigraphic position or later tectonic deformation and is probably due to the presence of excess 40Ar between crystal layers (cf65). Excluding this measurement, a time span of ca. 106 kyr results between the oldest (8.822.7 ± 9.2 ka) and youngest plateau dates. These dates likely represent cooling ages, as Ar diffusion closure temperatures of mica (~ 300–400 °C66,67) are lower than the emplacement temperatures of highly-fluxed, rare-metal rich, peraluminous granite systems (e.g., ~ 560–590 °C solidus temperature for the Beauvoir granite, France68) and LCT pegmatites (~ 400–500 °C61,69). Since the dated micas occur as crystal clasts within tuffaceous mudstone, the youngest date provides a maximum constraint on the eruption age.

40Ar/39Ar step heating profiles for zinnwaldite-lepidolite crystal clasts from Lithium-rich Tuff samples from the Macusani Volcanic Field. The 2021-MAC-05 age is recalibrated using the concordant inverse isochron 40Ar/36Ar 40Ar/36Ar intercept of 321.8 ± 0.3.
The new dates, even including that of sample 2021-MAC-048, fall between the two previously documented eruptive episodes in the Macusani Formation at 10 ± 1 Ma and 7 ± 1 Ma11. Notably, these dates do not overlap with any radiometric ages obtained from other extrusive and intrusive units from the Macusani Volcanic Field (Fig. 1) or from other volcanic fields within the Macusani Structural Zone and adjacent morphostructural domains (Fig. 8). It follows that the cooling of the lithium mica crystal clasts in the Lithium-rich Tuff occurred during an apparently short regional magmatic lull—lasting at least 1 Myr between ca. 10 ± 1 and 7 ± 1 Ma11—in the Eastern Cordillera of the Central Andes in southern Peru. Beyond their distinctive age, the chemical composition of the lithium micas also differentiates them from micas found in other volcanogenic and intrusive units in the Macusani Volcanic Field (Figs. 5 and 6). Both observations eliminate the possibility that the lithium mica clasts were eroded from older igneous rocks.

Geochronologic chart of Cenozoic rocks in the Macusani Structural Zone and Cordillera de Carabaya6,9,10,11,15,20,21,22,23,70,71,72,73, including the new 40Ar/39Ar zinnwaldite-lepidolite dates on Lithium-rich Tuff from the Falchani Lithium Project in the Macusani Volcanic Field. Some of the published 40Ar/39Ar ages11,15,72 were calibrated against a LP-6 fluence monitor that does not have reliable intercalibration factors to the Fish Canyon Tuff sanidine monitor74. However, the available intercalibration ratios75 indicate the previously determined ages should be ~ 1% older when recalculated using the same decay constant and fluence monitor age as our new age determinations.
Both the Neogene Picotani and Quenamari groups, the latter including the Macusani Formation, and cogenetic shallow intrusive suites15 are excellent examples of peraluminous magmatism in a back-arc position during extensional tectonics affecting a previously overthickened crust8 (see also76 for further global examples). This setting can be nicely demonstrated in the study area. At the approximate latitudes of the Macusani Volcanic Field, the nearby Coasa Pluton in Cordillera de Carabaya records two periods of significant uplift and exhumation at ca. 30 − 26 Ma and 17 − 11 Ma29. Each of these exhumation periods was followed by the emplacement of voluminous, mostly peraluminous, volcanic—and cogenetic hypabyssal—units of the Picotani (from ca. 24 Ma) and Quenamari (from ca. 10 Ma) groups in the Macusani Volcanic Field15.
According to Pichavant et al.8, decompression of the overthickened crust favored mantle upwelling and injection of mantle-derived magmas into the crust. Mantle-derived magmas, mostly potassic – ultra-potassic in nature77,78, contributed heat and volatiles and triggered dehydration melting of F-rich mica in the crustal source region. As concluded by Pichavant et al.8, the high-temperature, H2O-unsaturated melting conditions and abundance of volatiles such as F were key to extensive magma fractionation and allowed the shallow emplacement, and even extrusion, of the peraluminous magmas. Taking into account this general scenario, the fact that the Macusani Formation records two main eruptive episodes separated by a ca. 1 Myr gap suggests a pulsatile character of magmatism that could be related with disruption of the aforementioned lithosphere-scale dynamics. It is noteworthy that the short magmatic lull coincides with the onset of the Altiplano uplift at the latitudes of Macusani (∼14 to 16 ºS) from ca. 9 Ma79, suggesting that a regional tectonic perturbation could have discontinued ignimbritic magmatism. As a working hypothesis, we propose that transient compressional tectonics inhibited magma rise to surface and delayed ignimbritic eruption from a thermally primed middle and upper crust (cf80), thus favoring the extra magmatic differentiation and volatile-phase build up necessary to crystallize the highly evolved lithium micas at ca. 8.9 Ma in the Lithium-rich Tuff. The related tectonic mechanism is unknown, but it was plausibly related to the propagation of the East Andean Thrust ramp or conjugate west-verging faults in the Eastern Cordillera associated with accelerated westward subduction of the Brazilian shield since ca. 10–7 Ma81.
In summary, magmatism slowdown and volcanic arrest might have promoted extreme magma differentiation in a long-lived, crystal-rich magma reservoir and the production of pressurized magmatic volatile phases that were exceptionally rich in incompatible, fluid-mobile elements. Volumetrically restricted tuffaceous units in peraluminous volcanic fields deposited between ignimbrite flare-ups stand as prospective for volcanogenic lithium deposits in the Neogene Ignimbrite Province of the Central Andes. Furthermore, this study presents the first documented occurrence of lithium micas in pyroclastic rocks, with significant implications for lithium exploration. Our findings identify volcanogenic sedimentary deposits in peraluminous volcanic fields as promising exploration targets globally, establishing a framework that expands lithium resource exploration beyond traditional deposit types.
Materials and methods
Materials
Micas from a total of 14 rock samples were analyzed. The selected rock samples are representative of the Lithium-rich Tuff (n = 8), the Macusani Formation (Quenamari Group) ash-flow tuff (n = 2), the Quenamari Suite granite (n = 1), the Picotani Group ash-flow tuff (n = 1), and the Picotani Suite granite (n = 2; Fig. S1). Eleven of the samples were extracted from rock outcrops, and the remaining three samples were extracted from drill holes. Detailed descriptions of the sampled rock units are provided in a Supplementary Dossier. A list of the studied samples, their ___location, and brief textural and mineralogical descriptions is provided inTable S1. Pictures of individual rock samples are provided in Fig. S3.
Field emission SEM (FE-SEM)
The textures of the mica grains and matrix in the Lithium-rich Tuff were studied with a JEOL JSM-7001 F field emission scanning electron microscope (FE-SEM) at the Scientific and Technological Centers of the Universitat de Barcelona (CCiT-UB; Spain). The instrument was operated at an accelerating voltage of 20 kV.
Electron probe micro analyzer (EPMA)
Major and minor element (Si, Ti, Al, Fe, Mg, Mn, Ca, K, Na, Ba, Rb, Zn, F, and Cl) contents in micas were obtained using an Electron Probe Micro Analyzer (EPMA) at the Centre Castaing - University Paul Sabatier (Toulouse, France) with a CAMECA SXFive instrument. Surface areas of 2 × 2 μm were analyzed with an accelerating voltage of 15 kV and a beam current of 10 nA. The calibration standards consisted of topaz (F), albite (Na), periclase (Mg), corundum (Al), tugtupite (Cl), sanidine (K), wollastonite (Ca, Si), pyrophanite (Mn, Ti), hematite (Fe), chromium oxide (Cr), barite (Ba), and Ge-Al-Ca-Rb glass (Rb). The structural formula of micas was normalized to 11 O, and H2O was determined by assuming (OH + F + Cl) = 2 atoms per formula unit (apfu). Lithium contents from EPMA data were calculated using equations tri1 [SiO2 > 34% and MgO < 6%] and tri2 [SiO2 > 34% and MgO > 6%] of Tischendorf et al.35. Chemical compositions of micas are reported in weight per cent (wt%) of the oxides, and the structural formulae are expressed in apfu in Table S2.
Elemental X-ray maps of micas were performed at the CCiT-UB using a JEOL JXA-8230 electron microprobe equipped with five wavelength-dispersive spectrometers (WDS). The instrument was operated at 15 kV accelerating voltage, 10 nA beam current, and a beam diameter of 1 μm. A first map covering a whole mica grain (Fig. S4) was obtained with a step (pixel) size of 1 μm and a dwell time of 40 ms. A second map covering a zoned rim of a mica grain (Fig. 3) was obtained with a step (pixel) size of 0.30 μm and a dwell time of 50 ms. The X-ray maps were converted into concentration maps by applying the ZAF matrix correction, assuming O2 by stoichiometry, and using the following natural and synthetic standards: diopside (Si), kyanite (Al), rutile (Ti), Cr2O3 (Cr), periclase (Mg), albite (Na), fluorite (F), hematite (Fe), rhodonite (Mn), wollastonite (Ca), orthoclase (K), barite (Ba), and RTP (RbTiOPO4; Rb).
LA-ICP-MS
The mica trace-element content was analyzed by laser ablation – inductively coupled plasma – mass spectrometry (LA-ICP-MS) using a femtosecond laser ablation system (ESI - New Wave NWRfemto) coupled to an Element HR-ICPMS (ThermoScientific) at the Service ICP-MS of Observatoire Midi-Pyrénées in Toulouse, France. The optimal laser configuration was determined by carrying out several experimental measurements on different types of mica with different chemistries and resistance to the laser pulse, in order to avoid the transition from pulse counting to analogue counting mode during the acquisition. The selected laser parameters comprise an energy level of 20% (resulting in a fluence of ca. 3 Jcm− 2), a frequency of 8 Hz and a spot diameter of 40 μm. The exception to this is the lepidolite rims, where ablation was performed using a 20 μm spot diameter due to limited size of the rim. Ablation was carried out in the built-in, dual-volume sample chamber (effective washout volume < 1 cm3), fluxed with carrier gas consisting of high-purity helium (ca. 600 mL/min) to which was admixed argon from the ICP-MS (ca. 0.87 L/min) downstream of the ablation chamber. Each acquisition was segmented in 20 s of background recording followed by 25 s of ablation.
Before each analysis session, the ICP-MS was fine-tuned by ablating a reference material made of NIST SRM 610 glass82 to ensure highest sensitivity across the entire mass range while keeping the oxide formation rate as low as possible (typically, 254UO+/238U+ <0.1%) and elemental fractionation (U/Th) as close to 1 as possible. Intensities were acquired in static, triple detector mode (pulse counting, analog and Faraday) for the following masses: 7Li, 9Be, 23Na, 25Mg, 27Al, 31P, 39K, 49Ti, 55Mn, 57Fe, 72Ge, 85Rb, 88Sr, 90Zr, 93Nb, 118Sn, 132Cs, 138Ba, 180Hf, 181Ta, 182W, 232Th, and 238U. Dwell times were set to 20 ms for all elements.
The resulting intensities were processed offline with the Iolite v2.5 software, using the built-in data reduction scheme for trace elements83. Determination of elemental sensitivities and correction of instrumental drift were performed using NIST SRM 612 glass reference material82 using conventional standard-sample bracketing. Relative sensitivity (i.e. matrix effect) was corrected employing the mica Si content measured by EPMA as an internal standard. The accuracy and reproducibility of the analyses were validated by running repeated analyses of reference materials (NIST SRM 610, BHVO-2G82,84). To detect the occurrence of mineral inclusions, the presence of anomalous peaks in the flat part of the signal was monitored and excluded from the integration. Detection limits are provided for each element in supplementary materials. Total uncertainties were below 20% relative for concentrations at least one order of magnitude above the detection limit. The LA-ICP-MS results are presented in Table S3.
Raman
Raman spectra were obtained on polished thin sections with a HORIBA JobinYvon LabRam HR 800 dispersive spectrometer equipped with an Olympus BXFM optical microscope at the CCiT-UB. Non polarized spectra were obtained in confocal geometry by applying a 532 nm laser, using 50x and 100x objectives (beam size around 2 μm), with 5 measurement repetitions for 20 s each. The instrument was calibrated by checking the position of the metallic Si band at ~ 520 cm− 1. The spectra were processed using the LabSpec® software (JobinYvon). The final spectra were produced by extracting the background fluorescence, and in some cases the white lamp was also removed in order to minimize the instrument noise (Fig. S5).
Transmission electron microscopy
The samples were first disaggregated, dispersed in ethanol, and sonicated. Mica grains were deposited onto Formvar®-covered Cu grids to determine their composition by Analytical Electron Microscopy (AEM) in a HAADF Thermo Fisher Scientific TALOS F200X Transmission Electron Microscope (TEM) at the Centro de Instrumentación Científica of the Universidad de Granada (CIC-UGR; Spain). Operating conditions were 200 kV, with a point-to-point resolution of 1.2 Å in the TEM mode and 1.9 Å in the scanning (STEM) mode. The quantitative micro- to nano-chemical analyses in STEM mode were obtained by energy dispersive X-ray microscopy (AEM-EDX) using the Super-X system. Mineral standards were used to obtain K-factors according to the method proposed by Lorimer and Cliff85. AEM results are provided in Table S4.
High-resolution TEM (HRTEM) images and selected-area electron diffraction (SAED) patterns were taken with a HAADF FEI TITAN G2 instrument with a XFEG emission gun, spherical aberration corrector, and HAADF detector, operated at 300 kV, at the CIC-UGR. The point-to-point resolution was 0.8 Å in the HRTEM mode and 2 Å in the STEM mode. To prepare the samples for these analyses, copper rings were glued to selected areas of interest of the three samples prepared as thin sections with a thermo-fusible resin, so that the TEM specimens could be separated from the sections via moderate heating. This mode of preparation allowed the preservation of the original textural relations of the minerals in the sample (Figs. S6-S8). These specimens were further thinned with a Fischione Model 1010 ion mill at 5 mA and an accelerating voltage of 5 kV at ± 15° until the first hole was achieved, and 3 kV for final cleaning, first at ± 7° and after at ± 5°, and were finished with carbon coating.
40Ar/39Ar geochronology
Micas separates from the nine selected rock samples were analyzed by the 40Ar/39Ar incremental heating method at the Nevada Isotope Geochronology Laboratory at the University of Nevada, Las Vegas. To perform the irradiation, the samples were wrapped in Al foil and stacked in sealed fused silica tubes with internal diameter of 6 mm. Neutron fluence monitors (Fish Canyon Tuff sanidine) were placed at the base, top, and between every three unknown samples in the tube. Additionally, to monitor neutron induced argon interferences from K and Ca, synthetic K-glass and optical grade CaF2 were included in the irradiation packages. The loaded tubes were packed in an Al container and irradiated for six hours at the Oregon State TRIGA Reactor in Corvallis, Oregon. J factors were determined by fusion of 6–10 individual crystals of neutron fluence monitors. The determined J values were used to fit a 2nd order error weighted polynomial curve and interpolated by height to determine the J value for each unknown sample.
To perform the step heating method for analyzing the samples, a double vacuum resistance furnace was used. At each heating step, reactive gases were removed by three GP-50 SAES getters before being admitted into an Isotopx NGX multi-collector mass spectrometer. Faraday cups with ATONA amplifiers were used to measure peak intensities for m/z 40, 39, 38, and 37. The 36 m/z peak was measured using an ion counting discrete dynode electron multiplier. Mass discrimination factors (MDF) were monitored assuming an atmospheric 40Ar/36Ar value of 298.5686. Furnace blanks were analyzed at appropriate incrementally increasing temperatures immediately prior to sample admittance. All age determinations and associated uncertainties were calculated using ArArCalc v.2.7.087. The uncertainties are provided at a 2σ confidence level and include errors in data regression, baseline corrections, irradiation constants, the J curve value, mass fractionation, blanks, and post irradiation decay of 37Ar and 39Ar. External uncertainties include additional propagated errors from natural element abundances, the decay constant, and fluence monitor age. An age of 28.201 Ma88 was used for the Fish Canyon Tuff sanidine fluence monitor when calculating ages for the samples. Ages were calculated using the total 40K decay constant of 5.530 ± 0.097 × 10− 10 yr− 189.
For a successful 40Ar/39Ar date determination, a plateau segment must consist of five or more contiguous gas fractions having analytically indistinguishable ages (i.e., all plateau steps overlap in age at ± 2σ analytical error) and comprising a significant portion of the total gas released (> 50%). Total gas (integrated) ages were calculated by weighting by the amount of 39Ar released, whereas plateau ages are weighted by the inverse of the variance (Fig. 7; Tables S5-S13). For each sample, inverse isochron diagrams are examined to check for the effects of excess argon. Reliable isochrons and plateaus are checked using a probability of fit factor wherein values greater than 5% indicate a concordant plateau or isochron within the 2σ certainty.
Data availability
Data is provided within the manuscript and supplementary information files.
References
Linck, G. Ein Neuer kristallführender Tektit von Paucartambo in Peru. Chem. Erde. 2, 57–174 (1926).
Martin, R. & de Sitter-Koomans, C. Pseudotektites from Colombia and Peru. Leidse Geol. Meded. 20, 151–164 (1955).
Elliott, J. & Moss, A. Natural glass from Macusani, Peru. Min. Mag. 35, 423–424. https://doi.org/10.1180/minmag.1965.035.270.18 (1965).
Pichavant, M. et al. The Macusani glasses, SE Peru: Evidence of chemical fractionation in peraluminous magmas, in Magmatic Processes: Physicochemical Principles (ed. Mysen, B.O.). The Geochemical Society, Special Publication 1, 359–373 (1987).
London, D., Hervig, R. L. & Morgan, G. B. Melt-vapor solubilities and elemental partitioning in peraluminous granite-pegmatite systems: Experimental results with Macusani glass at 200 MPa. Contrib. Mineral. Petrol. 99, 360–373. https://doi.org/10.1007/BF00375368 (1988).
Pichavant, M., Kontak, D. J., Valencia Herrera, J. & Clark, A. H. The Miocene-Pliocene macusani volcanics, SE Peru - I. Mineralogy and magmatic evolution of a two-mica aluminosilicate-bearing ignimbrite suite. Contrib. Mineral. Petrol. 100, 300–324. https://doi.org/10.1007/BF00379741 (1988).
Pichavant, M., Kontak, D. J., Briqueu, L., Valencia Herrera, J. & Clark, A. H. The Miocene-Pliocene macusani volcanics, SE Peru - II. Geochemistry and origin of a felsic peraluminous magma. Contrib. Mineral. Petrol. 100, 325–338. https://doi.org/10.1007/BF00379742 (1988).
Pichavant, M., Villaros, A., Michaud, J. A. S. & Scaillet, B. Granite magmatism and mantle filiation. Eur. J. Mineral. 36, 225–246. https://doi.org/10.5194/ejm-36-225-2024 (2024).
Barnes, V. E., Edwards, G., McLaughlin, W. A., Friedman, I. & Joensuu, O. Macusanite occurrence, age, and composition, Macusani, Peru. Geol. Soc. Am. Bull. 81, 1539–1546. https://doi.org/10.1130/0016-7606(1970)81 (1970). [1539:MOAACM]2.0.CO;2.
Noble, D. C. et al. Rare-element-enriched, S-type ash-flow tufts containing phenocrysts of Muscovite, Andalusite, and sillimanite, southeastern Peru. Geology 12, 35–39. https://doi.org/10.1130/0091-7613(1984)12%3C35:RSATCP%3E2.0.CO;2 (1984).
Cheilletz, A. et al. Volcano-stratigraphy and 40Ar/39Ar geochronology of the macusani ignimbrite field: monitor of the miocene geodynamic evolution of the Andes of Southeast Peru. Tectonophysics 205, 307–327. https://doi.org/10.1016/0040-1951(92)90433-7 (1992).
Pichavant, M., Erdmann, S., Kontak, D. J. & Michaud, J. A. S. Trace element partitioning in strongly peraluminous rare-metal silicic magmas – Implications for fractionation processes and for the origin of the macusani volcanics (SE Peru). Geochim. Cosmochim. Ac. 365, 229–252. https://doi.org/10.1016/j.gca.2023.11.021 (2024).
Nupen, S. Mineral Resource Estimates for the Falchani Lithium Project in the Puno District of Peru – Prepared for Plateau Energy Metals Inc. Under the Guidelines of National Instrument 43–101 and Accompanying Documents NI 43–101.F1 and NI 43–101.CP72 (pp. (The Mineral Corporation, 2019).
Segovia-More, M. K. et al. High-resolution mineralogy of Lithium-rich Tuff from the Macusani Volcanic Field, Puno, Peru, in Proceedings, Society for Geology Applied to Mineral Deposits (SGA) Biennial Meeting, 17th, Zürich: Switzerland. Society for Geology Applied to Mineral Deposits 1, 303–306 (2023).
Sandeman, H. A., Clark, A. H., Farrar, E. & Arroyo, G. A. Lithostratigraphy, petrology and 40Ar/39Ar geochronology of the Crucero supergroup, Puno department, SE Peru. J. S Am. Earth Sci. 10, 223–245. https://doi.org/10.1016/S0895-9811(97)00023-0 (1997).
López, J. Mapa geológico del cuadrángulo de Nuñoa departamentos de Puno y Cusco, scale 1:100,000 (Instituto Geológico Minero y Metalúrgico, (1996).
Choquehuanca, S., Latorre, O. & Soberon, D. Mapa Geológico Del cuadrángulo de Corani - Hoja 28u3 Carta geológica Nacional digital Scala 1: 50 000. Instituto Geológico Minero y Metalúrgico (INGEMMET), Boletín Serie L: Actualización Carta Geológica Nacional (Escala 1: 50 000) n° 47 (2022).
Rodríguez, R. et al. Mapa Geológico Del cuadrángulo de Corani - Hoja 28u2 Carta geológica Nacional digital, scale 1:50,000. Instituto Geológico Minero y Metalúrgico (INGEMMET), Boletín Serie L: Actualización Carta Geológica Nacional (Escala 1: 50 000) n° 47 (2022).
Clark, A. H. et al. Occurrence and age of Tin mineralization in the Oriental Cordillera, Southern Peru. Econ. Geol. 78, 514–520. https://doi.org/10.2113/gsecongeo.78.3.514 (1983).
Kontak, D. J. The magmatic and metallogenetic evolution of a craton-orogen interface: The Cordillera de Carabaya, central Andes, SE Peru [Ph.D. 714 p. (Queen’s University, (1985).
Bonhomme, M. G., Fornari, M., Laubacher, G., Sebrier, M. & Vivier, G. Nuevas Edades K-Ar cenozoicas de Rocas Volcánicas de La cordillera de Los Andes, Sur este Del Perú. Comun. Del. Departamento De Geología Universidad De Chile. 35, 33 (1985).
Kontak, D. J., Clark, A. H., Farrar, E., Archibald, D. A. & Baadsgaard, H. Geochronological data for tertiary granites of the Southeast Peru segment of the central Andean Tin belt. Econ. Geol. 82, 1611–1618. https://doi.org/10.2113/gsecongeo.82.6.1611 (1987).
Poupeau, G. et al. Fission-track and K-Ar ages of macusanite Obsidian glasses, (SE Peru): geodynamic implications. Tectonophysics 205, 295–305. https://doi.org/10.1016/0040-1951(92)90432-6 (1992).
Baby, P., Rochat, P., Mascle, G. & Hérail, G. Neogene shortening contribution to crustal thickening in the back Arc of the central Andes. Geology 25, 883–886. https://doi.org/10.1130/0091-7613(1997)025%3C0883:NSCTCT%3E2.3.CO;2 (1997).
McQuarrie, N., Horton, B. K., Zandt, G., Beck, S. & DeCelles, P. G. Lithospheric evolution of the Andean fold–thrust belt, Bolivia, and the origin of the central Andean plateau. Tectonophysics 399, 15–37. https://doi.org/10.1016/j.tecto.2004.12.013 (2005).
McQuarrie, N., Barnes, J. B. & Ehlers, T. A. Geometric, kinematic, and erosional history of the central Andean plateau, Bolivia (15–17°S). Tectonics 27, TC3007. https://doi.org/10.1029/2006TC002054 (2008).
Sempere, T. et al. Late Permian–Middle jurassic lithospheric thinning in Peru and Bolivia, and its bearing on Andean-age tectonics. Tectonophysics 345, 153–181. https://doi.org/10.1016/S0040-1951(01)00211-6 (2002).
Perez, N. D., Horton, B. K. & Carlotto, V. Structural inheritance and selective reactivation in the central Andes: cenozoic deformation guided by pre-Andean. Struct. South. Peru Tectonophysics. 671, 264–280. https://doi.org/10.1016/j.tecto.2015.12.031 (2016).
Perez, N. D., Horton, B. K., McQuarrie, N., Stübner, K. & Ehlers, T. A. Andean shortening, inversion and exhumation associated with thin- and thick-skinned deformation in Southern Peru. Geol. Mag. 153, 1013–1041. https://doi.org/10.1017/S0016756816000121 (2016).
Baby, P. et al. The Peruvian sub-andean foreland basin system: structural overview, geochronologic constraints, and unexplored plays in Petroleum Basins and Hydrocarbon Potential of the Andes of Peru and Bolivia (ed. Zamora, G., McClay, K. R. & Ramos, V. A.). AAPG Memoir. 117; (2018). https://doi.org/10.1306/13622118M1173767
de Silva, S. L. et al. Large ignimbrite eruptions and volcanotectonic depressions in the Central Andes: A thermomechanical perspective in Mechanisms of Activity and Unrests at Large Calderas (ed. de Natale, G., Troise, C. & Kilburn, C.). Geol. Soc. S. P. 269, 47–63; (2006). https://doi.org/10.1144/GSL.SP.2006.269.01.04
McPhie, J., Doyle, M. & Allen, R. L. Volcanic Textures: a Guide To the Interpretation of Textures in Volcanic Rocks. 196 Pp (University of Tasmania, Centre for Ore Deposit and Exploration Studies, 1993).
Whitney, D. L. & Evans, B. W. Abbreviations for names of rock-forming minerals. Am. Mineral. 95, 185–187. https://doi.org/10.2138/am.2010.3371 (2010).
RRUFF. Integrated database of Raman spectra, X-ray diffraction and chemistry data for minerals. October (2024). https://rruff.info/ (accessed.
Tischendorf, G., Gottesmann, B., Förster, H. J. & Trumbull, R. B. On Li-bearing micas: estimating Li from electron microprobe analyses and an improved diagram for graphical representation. Mineral. Mag. 61, 809–834. https://doi.org/10.1180/minmag.1997.061.409.05 (1997).
Monier, G. & Robert, J. L. Evolution of the miscibility gap between Muscovite and biotite solid solutions with increasing lithium content: an experimental study in the system K2O-Li2O-MgO-FeO-Al2O3-SiO2-H2O-HF at 600 ºC, 2 Kbar P H2O: comparison with natural lithium Micas. Mineral. Mag. 50, 641–651. https://doi.org/10.1180/minmag.1986.050.358.09 (1986).
Monnier, L. et al. Mica trace-element signatures: highlighting superimposed W-Sn mineralizations and fluid sources. Chem. Geol. 600, 120866. https://doi.org/10.1016/j.chemgeo.2022.120866 (2022).
Breiter, K. et al. Trace element composition of Micas from rare-metal granites of different geochemical affiliations. Lithos 446–447. https://doi.org/10.1016/j.lithos.2023.107135 (2023).
Peng, H. W. et al. Mica geochemistry as an indicator of magmatic-hydrothermal processes in the Ta-Nb-Sn-W mineralization of the Limu deposit, South China. Ore Geol. Rev. 160, 105584. https://doi.org/10.1016/j.oregeorev.2023.105584 (2023).
Charoy, B. & Noronha, F. Multistage growth of a rare-element, volatile-rich microgranite at argemela (Portugal). J. Petrol. 37, 73–94. https://doi.org/10.1093/petrology/37.1.73 (1996).
Michaud, J. A. S. & Pichavant, M. Magmatic fractionation and the magmatic-hydrothermal transition in rare metal granites: evidence from argemela (Central Portugal). Geochim. Cosmochim. A. 289, 130–157. https://doi.org/10.1016/j.gca.2020.08.022 (2020).
Breiter, K. et al. Rock textures and mineral zoning – A clue to Understanding rare-metal granite evolution: argemela stock, Central-Eastern Portugal. Lithos 410–411, 106562. https://doi.org/10.1016/j.lithos.2021.106562 (2022).
Förster, H. J., Tischendorf, G., Trumbull, R. B. & Gottesmann, B. Late-collisional granites in the variscan Erzgebirge, Germany. J. Petrol. 40, 1613–1645. https://doi.org/10.1093/petroj/40.11.1613 (1999).
Villaros, A. & Pichavant, M. Mica-liquid trace elements partitioning and the granite-pegmatite connection: the St-Sylvestre complex (Western French Massif Central). Chem. Geol. 528, 119265. https://doi.org/10.1016/j.chemgeo.2019.07.040 (2019).
Chen, X. et al. Whole-rock geochemistry and mica compositions in Lijiagou pegmatite spodumene deposit, Western Sichuan, China. Minerals 14 (69). https://doi.org/10.3390/min14010069 (2024).
Anderson, M. O., Lentz, D. R., McFarlane, C. R. M. & Falck, H. A geological, geochemical and textural study of a LCT pegmatite: implications for the magmatic versus metasomatic origin of Nb–Ta mineralization in the moose II pegmatite, Northwest territories, Canada. J. Geosci-Czech. 58, 299–320. https://doi.org/10.3190/jgeosci.149 (2013).
Bau, M. Controls on the fractionation of isovalent trace elements in magmatic and aqueous systems: evidence from Y/Ho, Zr/Hf, and lanthanide tetrad effect. Contrib. Mineral. Petrol. 123, 323–333. https://doi.org/10.1007/s004100050159 (1996).
Münker, C. et al. Evolution of planetary cores and the Earth-Moon system from Nb/Ta systematics. Science 301, 84–87. https://doi.org/10.1126/science.1084662 (2003).
Schmidt, M. W., Dardon, A., Chazot, G. & Vannucci, R. The dependence of Nb and Ta rutile-melt partitioning on melt composition and Nb/Ta fractionation during subduction processes. Earth Planet. Sci. Lett. 226, 415–432. https://doi.org/10.1016/j.epsl.2004.08.010 (2014).
Linnen, R. L. & Keppler, H. Columbite solubility in granitic melts: consequences for the enrichment and fractionation of Nb and Ta in the Earth’s crust. Contrib. Mineral. Petrol. 128, 213–227 (1997).
Linnen, R. L. & Keppler, H. Melt composition control of Zr/Hf fractionation in magmatic processes. Geochim. Cosmochim. Acta. 66, 3293–3301 (2002).
Ballouard, C. et al. Nb-Ta fractionation in peraluminous granites: A marker of the magmatic-hydrothermal transition. Geology 44, 231–234. https://doi.org/10.1130/G37475.1 (2016).
Dostal, J. & Chatterjee, A. K. Contrasting behaviour of Nb/Ta and Zr/Hf ratios in a peraluminous granitic Pluton (Nova Scotia, Canada). Chem. Geol. 163, 207–218. https://doi.org/10.1016/S0009-2541(99)00113-8 (2000).
Yin, R. et al. Textural and chemical variations of Micas as indicators for tungsten mineralization: evidence from highly evolved granites in the Dahutang tungsten deposit, South China. Am. Mineral. 104, 949–965. https://doi.org/10.2138/am-2019-6796 (2019).
Choi, W. et al. Magmatic to aqueous phase transition in Li-pegmatite: microtextural and geochemical study of muscovite–lepidolite from Boam mine area, Uljin, South Korea. Min. Deposita. 59, 1641–1660. https://doi.org/10.1007/s00126-024-01286-z (2024).
Putzolu, F. et al. Influence of magmatic and magmatic-hydrothermal processes on the lithium endowment of Micas in the cornubian batholith (SW England). Min. Deposita. 59, 1067–1088. https://doi.org/10.1007/s00126-024-01248-5 (2024).
Iveson, A. A., Webster, J. D., Rowe, M. C. & Neill, O. K. Fluid-melt trace-element partitioning behaviour between evolved melts and aqueous fluids: experimental constraints on the magmatic-hydrothermal transport of metals. Chem. Geol. 516, 18–41. https://doi.org/10.1016/j.chemgeo.2019.03.029 (2019).
Pelton, A. D. & Chartrand, P. Thermodynamic evaluation and optimization of the LiCl-NaCl-KCl-RbCl-CsCl-MgCl2-CaCl2 system using the modified quasi-chemical model. Metall. Mater. Trans. A. 32, 1361–1383. https://doi.org/10.1007/s11661-001-0227-2 (2001).
Songster, J. & Pelton, A. Thermodynamic calculation of phase diagrams of the 60 common-ion ternary systems containing cations Li, Na, K, Rb, Cs and anions F, Cl, Br, I. J. Phase Equilib. 12, 511–537. https://doi.org/10.1007/BF02645064 (1991).
FactSage. October (2024). http://www.factsage.cn/fact/documentation/FTsalt/CsCl-LiCl.jpg (Accessed.
McCaffrey, D. M. & Jowitt, S. M. The crystallization temperature of granitic pegmatites: the important relationship between undercooling and critical metal prospectivity. Earth-Sci. Rev. 244, 104541. https://doi.org/10.1016/j.earscirev.2023.104541 (2023).
Xu, X. et al. Magnetite-apatite ores record widespread involvement of molten salts. Geology 52, 417–422. https://doi.org/10.1130/G51887.1 (2024).
Simόn, V. et al. Fluid evolution of the Lindero porphyry gold deposit, NW Argentina: the critical role of salt melts in ore formation. Min. Deposita. 59, 1455–1477. https://doi.org/10.1007/s00126-024-01275-2 (2024).
Ellis, B. S. et al. Biotite as a recorder of an exsolved Li-rich volatile phase in upper-crustal silicic magma reservoirs. Geology 50, 481–485. https://doi.org/10.1130/G49484.1 (2022).
Bachmann, O., Schoene, B., Schnyder, C. & Spikings, R. The 40Ar/39Ar and U/Pb dating of young rhyolites in the Kos-Nisyros volcanic complex, Eastern Aegean Arc, Greece: age discordance due to excess 40Ar in biotite. Geochem. Geophy Geosy. 11, Q0AA08. https://doi.org/10.1029/2010GC003073 (2010).
McDougall, I. & Harrison, T. M. Geochronology and thermochronology by the 39Ar/40Ar method (Oxford University Press, 1999).
Snee, L. W., Sutter, J. F. & Kelly, W. C. Argon thermochronology of mineral deposits—A review of analytical methods, formulation, and selected applications. U.S. Geol. Surv. Bull. 2194, 1–32 (2002).
Pichavant, M., Boher, M., Stenger, J. F., Aïssa, M. & Charoy, B. Relations de phases des granites de Beauvoir à 1 et 3 Kbar En condition de saturation En H₂O. Mém Géol Profonde Fr. 2–3, 77–86 (1987).
Bradley, D. C., McCauley, A. D. & Stillings, L. M. Mineral-deposit model for lithium-cesium-tantalum pegmatites. U S Geol. Surv. Sci. Investig Rep. https://doi.org/10.3133/sir20105070O (2017). 2010–5070–O, 48.
Bonhomme, M. G., Audebaud, E. & Vivier, G. Edades K-Ar de Rocas Hercínicas y neógenas de Un perfil E-W En El Perú meridional. Comun. Del. Departamento De Geología Universidad De Chile. 35, 27–30 (1985).
Laubacher, G., Sebrier, M., Fornari, M. & Carlier, G. Oligocene and miocene continental sedimentation, tectonics, and S-type magmatism in the southeastern Andes of Peru (Crucero Basin): Geodynamic implications. J. S Am. Earth Sci. 1, 225–238. https://doi.org/10.1016/0895-9811(88)90001-6 (1988).
Farrar, E., Yamamura, B. K., Clark, A. H. & Taipe, J. Ar/39Ar ages of magmatism and tungsten-polymetallic mineralization, Palca 11, choquene district, southeastern Peru. Econ. Geol. 85. 40, 1669–1676. https://doi.org/10.2113/gsecongeo.85.7.1669 (1990).
Poupeau, G. et al. Fission-track dating of 15 macusanite glass pebbles from the macusani volcanic field (SE Peru). Nucl. Tracks Rad Meas. 21, 499–506. https://doi.org/10.1016/1359-0189(93)90189-G (1993).
Baksi, A. K., Archibald, D. A. & Farrar, E. Intercalibration of 40Ar/39Ar dating standards. Chem. Geol. 129, 307–324. https://doi.org/10.1016/0009-2541(95)00154-9 (1996).
Spell, T. L. & McDougall, I. Characterization and calibration of 40Ar/39Ar dating standards. Chem. Geol. 198, 189–211. https://doi.org/10.1016/S0009-2541(03)00005-6 (2003).
García-Arias, M. et al. The tectonic significance of peri-Gondwanan late Neoproterozoic-Early palaeozoic felsic peraluminous magmatism. Earth-Sci. Rev. 254, 104803. https://doi.org/10.1016/j.earscirev.2024.104803 (2024).
Sandeman, H. A. & Clark, A. H. Commingling and mixing of S-type peraluminous, ultrapotassic and basaltic magmas in the cayconi volcanic field, cordillera de Carabaya, SE Peru. Lithos 73, 187–213. https://doi.org/10.1016/j.lithos.2003.12.005 (2004).
Carlier, G. et al. Potassic-ultrapotassic mafic rocks delineate two lithospheric mantle blocks beneath the Southern Peruvian Altiplano. Geology 33, 601–604. https://doi.org/10.1130/G21643.1 (2005).
Kar, N. et al. Rapid regional surface uplift of the Northern Altiplano plateau revealed by multiproxy paleoclimate reconstruction. Earth Planet. Sci. Lett. 447, 33–47. https://doi.org/10.1016/j.epsl.2016.04.025 (2016).
Tavazzani, L. et al. The role of latent heat buffering in the generation of high-silica rhyolites. J. Petrol.; https://doi.org/10.1093/petrology/egae072 (in press).
Armijo, R., Lacassin, R., Coudurier-Curveur, A. & Carrizo, D. Coupled tectonic evolution of Andean orogeny and global climate. Earth-Sci. Rev. 143, 1–35. https://doi.org/10.1016/j.earscirev.2015.01.005 (2015).
Jochum, K. P. et al. Determination of reference values for NIST SRM 610–617 glasses following ISO guidelines. Geostand Geoanal Res. 35, 397–429. https://doi.org/10.1111/j.1751-908X.2011.00120.x (2011).
Hellstrom, J. C., Paton, C., Woodhead, J. D., Hergt, J. M. & Iolite Software for spatially resolved LA-(quad and MC) ICP-MS analysis in Laser ablation ICP-MS in the Earth sciences: Current practices and outstanding issues (ed. Sylvester, P.). Mineralogical Association of Canada, Short Course 40, 343–348 (2008).
Jochum, K. P. et al. GeoReM: A new geochemical database for reference materials and isotopic standards. Geostand Geoanal Res. 29, 333–338. https://doi.org/10.1111/j.1751-908X.2005.tb00904.x (2005).
Lorimer, G. W. & Cliff, G. Analytical electron microscopy of minerals, in Electron Microscopy in Mineralogy (ed Wenk, H. R.) 506–519 ; https://doi.org/10.1007/978-3-642-66196-9_38 (Springer, (1976).
Lee, J. Y. et al. A redetermination of the isotopic abundances of atmospheric ar. Geochim. Cosmochim. Ac. 70, 4507–4512. https://doi.org/10.1016/j.gca.2006.06.1563 (2006).
Koppers, A. A. ArArCALC-software for 40Ar/39Ar age calculations. Comput. Geosci. 28, 605–619. https://doi.org/10.1016/s0098-3004(01)00095-4 (2002).
Kuiper, K. F. et al. Synchronizing rock clocks. Science 320, 500–504. https://doi.org/10.1126/science.1154339 (2008).
Min, K., Mundil, R., Renne, P. R. & Ludwig, K. R. A test for systematic errors in 40Ar/39Ar geochronology through comparison with U/Pb analysis of a 1.1-Ga rhyolite. Geochim. Cosmochim. Ac. 64, 73–98. https://doi.org/10.1016/S0016-7037(99)00204-5 (2000).
Acknowledgements
Technical assistance by Drs. Philippe de Parseval (EMPA), Xavier Llovet (EMPA), and Maria del Mar Abad (TEM) is acknowledged. We thank Macusani Yellowcake S.A.C. – American Lithium, in special to Dr. Ulises Solís, Gregorio Tasayco, and Miguel Cavani, for access to drill cores and technical data. The detailed and constructive comments from three anonymous reviewers and Xingcheng Liu, Editorial Board Member, are greatly appreciated.
Funding
This research work was supported by the Peruvian PROCIENCIA-FONDECYT project 122–2020 E041-2020-01-01.
Author information
Authors and Affiliations
Contributions
Conceptualization, L.T., J.R.B., L.M., C.V.B., J.V., O.L., S.S., P.B., J.A.P., and F.N.; methodology, L.T., M.K.S.F., L.M., C.V.B., K.A.Z., K.K., S.S., and F.N.; validation, K.K., J.A.P., O.B., and F.N.; data curation, L.T., J.R.B., L.M., C.V.B., K.A.Z., K.K., and F.N.; writing—original draft preparation, L.T., J.R.B., and M.K.S.F.; writing—review and editing, all authors; figure preparation, L.T., J.R.B., and M.K.S.F.; supervision, L.T., K.K., J.V., O.L., S.S., P.B., J.A.P., O.B., and F.N.; project administration, L.T.; funding acquisition, L.T., C.V.B., J.A.P. All authors reviewed the manuscript and approved the submitted version.
Corresponding author
Ethics declarations
Competing interests
The authors declare no competing interests.
Additional information
Publisher’s note
Springer Nature remains neutral with regard to jurisdictional claims in published maps and institutional affiliations.
Electronic supplementary material
Below is the link to the electronic supplementary material.
Rights and permissions
Open Access This article is licensed under a Creative Commons Attribution-NonCommercial-NoDerivatives 4.0 International License, which permits any non-commercial use, sharing, distribution and reproduction in any medium or format, as long as you give appropriate credit to the original author(s) and the source, provide a link to the Creative Commons licence, and indicate if you modified the licensed material. You do not have permission under this licence to share adapted material derived from this article or parts of it. The images or other third party material in this article are included in the article’s Creative Commons licence, unless indicated otherwise in a credit line to the material. If material is not included in the article’s Creative Commons licence and your intended use is not permitted by statutory regulation or exceeds the permitted use, you will need to obtain permission directly from the copyright holder. To view a copy of this licence, visit http://creativecommons.org/licenses/by-nc-nd/4.0/.
About this article

Cite this article
Torró, L., Ramirez-Briones, J., Sanandres-Flores, M.K. et al. Lithium mica clasts document magmatic evolution prior to eruption in the macusani volcanic field in peru. Sci Rep 15, 13023 (2025). https://doi.org/10.1038/s41598-025-96173-6
Received:
Accepted:
Published:
DOI: https://doi.org/10.1038/s41598-025-96173-6
