
Abstract
Functional genomics resources are critical for interpreting human genetic studies, but currently they are predominantly from European-ancestry individuals. Here we present the South African Blood Regulatory (SABR) resource, a map of blood regulatory variation that includes three South Eastern Bantu-speaking groups. Using paired whole-genome and blood transcriptome data from over 600 individuals, we map the genetic architecture of 40 blood cell traits derived from deconvolution analysis, as well as expression, splice and cell-type interaction quantitative trait loci. We comprehensively compare SABR to the Genotype Tissue Expression Project and characterize thousands of regulatory variants only observed in African-ancestry individuals. Finally, we demonstrate the increased utility of SABR for interpreting African-ancestry association studies by identifying putatively causal genes and molecular mechanisms through colocalization analysis of blood-relevant traits from the Pan-UK Biobank. Importantly, we make full SABR summary statistics publicly available to support the African genomics community.
Main
Genome-wide association studies (GWAS) have transformed our understanding of human diseases1, contributing to the development of new diagnostics, precision medicine approaches and treatments2. However, most associations are found in regulatory regions, making it difficult to determine causal genes and specific molecular mechanisms3. Functional genomics studies integrating genetics with transcriptomics, proteomics and metabolomics to map molecular quantitative trait loci (QTLs) have proven instrumental in bridging the gap between GWAS and mechanisms4. For example, expression QTLs have been proposed to explain a proportion of GWAS heritability, but the exact magnitude has been debated5,6,7.
So far, the vast majority of GWAS and functional genomic studies have been conducted in European-ancestry individuals, contributing to global disparities in our understanding and treatment of disease. As of 2020, almost 90% of all GWAS participants were of European ancestry, and over 70% of participants were recruited from just three countries8. While GWAS are becoming more ancestrally diverse, a lack of population-scale, ancestrally aligned functional genomic studies hinders their translation into actionable discoveries9.
This is particularly true for the African continent, which accounts for over 18% of the global population and has the highest amount of human genetic diversity, but has been consistently under-represented in genomic research10,11,12. Progress has been made in mapping genetic diversity on the continent, but there is still much work to be done13,14,15,16,17,18. The phenotypic impacts of this genetic diversity are being uncovered through GWAS that include continental Africans, but are still limited19,20,21,22,23. Functional genomic studies mapping regulatory variation in continental African cohorts exist but are relatively limited in the cell types captured or have modest numbers of individuals compared to European-ancestry studies24,25,26,27,28.
To help address this gap, we created the South African Blood Regulatory (SABR) resource, a map of blood regulatory variation in South Africans that includes three South Eastern Bantu-speaking (SEB) groups. Using the same gold-standard methods as the Genotype Tissue Expression (GTEx) Consortium, we mapped the genetic architecture of blood cell traits derived from deconvolution analysis, as well as expression, splice and cell-type interaction QTLs29. SABR identified thousands of QTLs only observed in African-ancestry individuals, including many conditionally independent eQTLs, and mapped more regulatory variation compared to GTEx whole blood despite a smaller sample size. Finally, we performed colocalization analysis of SABR QTLs with blood-relevant GWAS in African-ancestry individuals from the Pan-UK Biobank and identified both known and new putatively causal genes and molecular mechanisms for trait associations, demonstrating the utility of the resource to the African genomics community.
Results
Whole-genome and blood transcriptome sequencing
Participants were selected for inclusion in SABR from the previously recruited AWI-Gen cohort, which had existing genotype data generated using the H3Africa (H3A) SNP array for 10,603 individuals13,19,30. The AWI-Gen cohort includes the Agincourt and DIMAMO health and sociodemographic surveillance systems in rural northern South Africa, and the urban Soweto cohort at the Developmental Pathways for Health Research Unit in Gauteng31,32. These three AWI-Gen research centers recruited participants from eight major South African SEB groups, and three of these groups—Pedi or Bapedi (Sepedi speakers, Limpopo Province), Tsonga (Shangaan ethnic group who speak Xitsonga, Mpumalanga Province) and Zulu (isiZulu speakers, Gauteng Province)—were included in this study (Fig. 1a). Participants were selected for inclusion in this study based on clustering closely with one of the three SEB groups in principal component analysis and being minimally related. In total, 750 participants were enrolled and had venous whole blood collected for DNA and RNA extraction and sequencing.
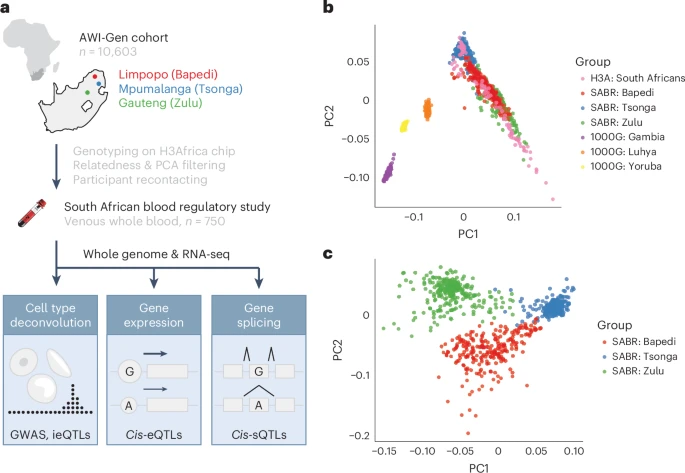
a, SABR blood transcriptome QTL study design. b, Principal component analysis of SABR participants and African-ancestry reference groups (1000 Genomes (1000G) and H3A). c, Principal component analysis of SABR participants without reference groups included.
DNA samples were whole-genome sequenced (WGS) to a median coverage of 5.1× (Supplementary Fig. 1a,b and Supplementary Table 1). Joint genotyping and imputation were performed, including reference populations and previously generated high-pass sequencing data of South African individuals, using an approach we previously described16,17,18,33,34. Structural variants from the Human Genome Structural Variation Consortium were genotyped using PanGenie and included in downstream analyses35. In principal component analysis, South Africans formed a distinct cluster from 1000 Genomes African populations and showed significant variation across individuals (Fig. 1b). Analysis within the SABR cohort clustered by SEB group (Fig. 1c). Given the genetic diversity of SABR participants, we sought to identify South African functional alleles and found 65 predicted high-impact coding variants (Combined Annotation-Dependent Depletion > 30) that had a minor allele frequency (MAF) > 1% in SABR and were unobserved in 1000 Genomes high-coverage whole genomes, including 24 stop-gain variants (Supplementary Fig. 1c and Supplementary Table 2). Two of these were identified in ClinVar as having uncertain pathogenic significance for systemic lupus erythematosus (rs113005222, DNASE1L3) and Cohen syndrome (rs373678127, VPS13B).
Sequencing was performed on RNA extracted from venous whole blood, resulting in a median depth of 30 M mapped read pairs, and data that showed acceptable quality metrics (Supplementary Fig. 1d and Supplementary Table 1). In total, 614 samples passed both RNA sequencing (RNA-seq) and genotyping quality control (QC) and were used for QTL mapping. Hidden transcriptome covariates to be included in QTL mapping were inferred using PEER factors36. As expected, they correlated with known biological and technical variables (Supplementary Figs. 2 and 3). RNA-seq reads were used to quantify expression levels and intron exclusion ratios of protein-coding and long noncoding RNA (lncRNA) genes.
Cell-type deconvolution
Whole blood is a highly dynamic tissue composed of many different circulating cell types, the composition of which can change based on both genetics and the environment. To estimate the relative abundance of blood cell types, we applied cell-type deconvolution analysis to the bulk transcriptome data37, which uses signatures of gene expression derived from purified cell types and calculates enrichment of those signatures in each sample. Such an approach has previously been used to successfully map cell-type interaction eQTLs from bulk data in tissues, including whole blood38. Using this approach, we estimated the levels of 40 blood-relevant cell types that had an enrichment score >0 in at least 50% of individuals (Fig. 2a and Supplementary Table 3). Reassuringly, the cell-type enrichment score distributions were broadly similar to those derived from GTEx whole-blood samples (Supplementary Fig. 4).

a, Distribution of cell-type enrichment scores calculated using xCell for 40 blood-relevant cell types stratified by lineage—HSCs (red), lymphoid cells (blue) and myeloid cells (green). b, Heatmap of effect estimates from a logistic regression model of disease and cell-type enrichment with cell types labeled by lineage. c, Combined Manhattan plot of 19 cell-type enrichment GWAS with at least one genome-wide significant hit (two-sided nominal P < 5 × 10⁻⁸ from linear regression model, dotted red line), with nearest genes and cell types listed for each locus. For each variant, the most significant association is plotted. For boxplots—bottom whisker, Q1–1.5× interquartile range (IQR); top whisker, Q3 + 1.5× IQR; box, IQR; center, median. HSCs, hematopoietic stem cells. CLP, common lymphoid progenitors; GMP, granulocyte-monocyte progenitors; CMP, common myeloid progenitors; iDC, immature dendritic cells; aDC, activated dendritic cells; MPP, multipotent progenitors; NKT, natural killer T cell.
Modeling deconvoluted cell types in disease
The extensive cell type estimates provided a unique opportunity to investigate changes in enrichment in the context of disease (Methods). There were six traits with at least 30 cases, including asthma (n = 32), diabetes (n = 31), HIV infection (n = 130), hypertension (n = 296), obesity (n = 214) and smoking (n = 200). At least one cell type was significantly associated with each trait (false discovery rate (FDR) < 0.05; Fig. 2b, Supplementary Fig. 6 and Supplementary Table 4).
Clustering diseases by cell-type enrichment changes formed three major groups (HIV; smoking and asthma; and diabetes, obesity and hypertension), mirroring disease etiology. HIV infection had the most significant cell-type associations, including with decreased levels of regulatory T cells (P = 6.80 × 10⁻⁹) and CD4+ T cells (P = 2.33 × 10⁻⁷) and increased levels of CD8+ T cells (P = 2.28 × 10⁻¹⁰), replicating known disease biology39,40,41. Hypertension was associated with an increase in neutrophils (P = 8.18 × 10⁻⁵) and a decrease in Th2 cells (P = 5.48 × 10⁻⁵), again replicating known biology42,43. Obesity was strongly associated with an increase in CD4+ TCM levels (P = 2.61 × 10⁻¹²) and a decrease in dendritic cells (P = 8.54 × 10⁻⁷). Positive correlations of CD4+ T cell levels with obesity and BMI have been previously reported, matching the observed results, while dendritic cells have been shown to increase in the adipose tissue of individuals with obesity44,45,46. Interestingly, smoking was associated with decreased CD4+ TCM levels (P = 2.16 × 10⁻¹⁵) and increased CD4+ TEM levels (P = 2.52 × 10⁻⁴). Based on the literature, there is a complex relationship between smoking and CD4+ T cells47,48. Finally, asthma was associated with decreased B cell levels (P = 3.73 × 10⁻³), including naive (P = 5.56 × 10⁻³) and memory (P = 8.57 × 10⁻³) subsets. However, other studies that showed a decrease in immature B cells demonstrated an increase in memory B cells, again indicating a complex relationship that may not be fully captured by cell-type deconvolution49.
GWAS of deconvoluted cell types
The genetic architecture of blood cell counts has proven to be relevant to disease biology and therapeutic development, but GWAS have largely been limited to cell types measured in standard complete blood count tests50,51. Using the deconvolution estimates, we identified 24 genome-wide significant (P < 5 × 10⁻⁸) associations with 19 cell types spanning 22 loci (Fig. 2c and Supplementary Table 5). Importantly, we replicated the well-known association of the ACKR1 Duffy-null allele with reduced neutrophil counts52 (rs2814778, P = 1.06 × 10⁻¹⁹). We also replicated a previously reported association at PIRAT1 with decreased eosinophil levels53 (rs6716126, P = 1.35 × 10⁻⁸). Overall, 10 of 22 loci, and 3 of 22 variants, were associated with blood cell counts in other studies54. In every case, at least one of the associations matched the lineage or cell type of the associations reported in SABR, validating the approach.
We also identified new associations, many with alleles that were rare or unobserved in non-African (East Asian, South Asian or European) 1000 Genomes continental ancestries. These included a locus containing a missense variant in SLC22A11 with decreased M2 macrophages (rs75976740, P = 4.55 × 10⁻⁸), and an intronic variant in CAMK2D associated with decreased CD8+ naive T cells (rs113109259, P = 1.97 × 10⁻⁸; Supplementary Fig. 7). In total, 5 of 22 unique lead GWAS variants were unobserved in non-African ancestries.
Cis-QTL mapping
We mapped cis genetic effects on gene expression (eQTLs) and splicing (sQTLs) for protein-coding and lncRNA genes using the same gold-standard approach as the GTEx consortium29. eQTL mapping across all three groups combined yielded better results than in each group independently, so this approach was used for all subsequent analyses, including for sQTL mapping (Methods; Supplementary Fig. 8 and Supplementary Table 6). Jointly mapping QTLs in all three SEB groups combined, at least one significant (FDR < 0.05) eQTL was mapped for 11,619 protein-coding and 2,572 lncRNA genes, and at least one significant sQTL was mapped for 3,466 protein-coding and 312 lncRNA genes (Fig. 3a and Supplementary Tables 7–10). The top-associated expression and splice variants showed the expected distribution of distance to transcription start site, MAF and slope (Supplementary Figs. 9 and 10). For 11 eQTLs and 4 sQTLs, the top QTL variant was a structural variant, and 2,132 eGenes had at least one structural variant with a nominally significant association (Supplementary Table 11).

a, Number of genes tested (red) and significant (blue, FDR < 5%) for expression and splice cis-QTLs, stratified by gene type. b, Number of conditionally independent cis-eQTLs mapped per eGene. c, Number of significant cis-ieQTLs mapped across 21 different cell types stratified by lineage (CLP, HSC, GMP, CMP, iDC and aDC). d, Example of a cis-ieQTL for FGFR2 that is dependent on eosinophil enrichment levels (interaction term two-sided P = 2.22 × 10⁻¹³ from linear regression model).
SABR cis-QTLs genotyped in GTEx whole blood, which included ~12% African American-ancestry individuals, replicated well (eQTLs—Storey’s π1 = 0.72, slope Spearman ρ = 0.81; sQTLs—π1 = 0.79, ρ = 0.87; Supplementary Fig. 11). Conversely, GTEx whole-blood cis-QTLs also replicated well in SABR (eQTLs—Storey’s π1 = 0.79, slope Spearman ρ = 0.80; sQTLs—π1 = 0.80, ρ = 0.84; Supplementary Fig. 12). Together, this demonstrates the robustness of cis-QTL mapping across cohorts and populations. When accounting for sample size, there was an increase in the number of genes with significant eQTLs (23.11 versus 17.97 eGenes/participant = 1.29×) and sQTLs (6.15 versus 4.50 sGenes/participant = 1.37×) compared to GTEx whole blood (Supplementary Fig. 13).
Independent cis-eQTL mapping
African-ancestry individuals exhibit the highest levels of genetic diversity and therefore would be expected to have a high degree of regulatory allelic heterogeneity14,16, presenting an opportunity for QTL studies to map multiple, independent signals per gene. To this end, we performed independent cis-eQTL mapping using stepwise regression and uncovered widespread allelic heterogeneity, with a total of 60,808 conditionally independent cis-eQTLs mapped (Supplementary Tables 12 and 13). There were a median of 4 and mean of 4.3 conditionally independent cis-eQTLs per gene (Fig. 3b), compared to a mean of 1.7 cis-eQTLs per gene in GTEx whole blood with a roughly equivalent sample size (670 in GTEx versus 614 in SABR).
Conditionally independent eQTLs showed marked differences from primary eQTLs, with decreasing MAF, increasing distance to eGene TSS and decreasing effect size as a function of conditional index (Supplementary Fig. 14a–d). Furthermore, a number of additional eVariants with predicted high impact were captured by conditional analysis, including 14 stop-gain variants (Supplementary Fig. 14e).
Cis-interaction eQTLs (ieQTL) mapping
Cell-type ieQTLs were mapped for 21 cell types that were either medically relevant or prevalent in whole blood using the same approach as the GTEx Consortium38. All 21 cell types had at least one significant ieGene mapped (FDR < 5%), with a total of 499 ieQTLs across 360 genes (Fig. 3c and Supplementary Tables 14 and 15). Mapped ieQTLs included those with cell-type-specific effects—for example, an ieQTL associated with increased expression of FGFR2 in eosinophils, the blood cell type in which the gene is most highly expressed (Fig. 3d). Of the 360 ieGenes, 287 were mapped in only one cell type, suggesting that each captured a unique regulatory architecture (Supplementary Fig. 15).
Both this study and ref. 38 mapped neutrophil ieQTLs using the same cell-type deconvolution approach in whole blood, which provided an opportunity for replication analysis. We tested significant GTEx ieQTLs (FDR < 5%) for replication in SABR and observed replication that was strongly dependent on the significance of the GTEx ieQTL (Supplementary Fig. 16a,b). Splitting the top 800 GTEx neutrophil ieQTLs into quartiles ordered by significance, we found strong replication of the top quartile (Storey’s π1 = 0.65, slope Spearman ρ = 0.25, P = 3.22 × 10⁻⁴), moderate replication of the second quartile (π1 = 0.21, slope Spearman ρ = 0.18, P = 0.01) and weak replication of the bottom two quartiles. This shows that the consistent mapping approach between the two studies results in robust replication of the most significant ieQTLs.
We also investigated the replication of SABR ieQTLs in eQTL studies from purified cell types where harmonized summary statistics were available55. In total, we tested 109 ieQTLs across six cell types (neutrophils, CD8+ T cells, monocytes, NK cells, B cells and CD4+ T cells) and found they replicated well (Storey’s π1 = 0.58, Spearman ρ = 0.63; Supplementary Fig. 16c,d). This suggests that a significant proportion of the ieQTLs mapped in SABR are likely eQTLs active in their corresponding cell types and provides validation of the deconvolution approach.
A South African map of blood regulatory variation
As this was a large blood transcriptome regulatory map generated in a continental African population, we sought to characterize QTLs mapped that were rare in other global ancestries. For each QTL type, we counted the number of unique, lead QTL variants that were unobserved (minor allele count = 0) in each 1000 Genomes continental ancestry (Fig. 4a). Between 29% and 35% of lead QTL variants were unobserved in non-African ancestries, demonstrating the unique nature of the SABR resource. Furthermore, we identified hundreds of QTL variants that were also unobserved in 1000 Genomes African ancestry, underscoring the genetic diversity across the continent. Finally, we determined whether QTL variants were found in eQTLGen, the largest eQTL resource from European ancestry individuals, with over 30,000 individuals56. Overall, 44.7% of SABR eVariants were not reported in eQTLGen full summary statistics, confirming the unique nature of the resource even compared to the largest European studies.

a, Proportion of lead cis-QTL variants that are unobserved in 1000 Genomes continental ancestries. The number of unique QTL variants is listed for each QTL type. b, Example of a predicted stop-gain eQTL for NIPSNAP3A unobserved in non-African ancestries (rs34856872, MAF 1000G African ancestry = 3.9%). c, Example of a predicted splice donor variant sQTL for KIF16B unobserved in 1000 Genomes (rs138620712, MAF SABR = 2.1%). Participant counts are listed in parentheses under genotype classes (0:C/C, 1:C/T, 2:T/T, 1:C/A). d, Proportion of conditionally independent cis-eQTLs stratified by index that are unobserved in either non-African or African 1000 Genomes ancestries. The significance of the difference in proportion of unobserved alleles between index 1 and 5+ eQTLs was calculated using a two-sided Fisher’s exact test. Non-African refers to East Asian, South Asian and European ancestry 1000 Genomes individuals. For boxplots—bottom whisker, Q1 − 1.5× IQR; top whisker, Q3 + 1.5× IQR; box, IQR; center, median. The P values shown for QTLs are two-sided from the linear regression model.
Examples of regulatory variation unobserved in non-African ancestries included an eQTL for NIPSNAP3A (rs34856872, P = 1.35 × 10−61, β = −1.44) that is a predicted stop-gain variant present at 3.9% frequency in 1000 Genomes African ancestry and 3.4% in SABR (Fig. 4b), and an sQTL for KIF16B (rs138620712, P = 3.36 × 10⁻²⁸, β = 2.03) that is a predicted splice donor variant, unobserved in 1000 Genomes African ancestry and present at 2.1% in SABR (Fig. 4c). Finally, we found that conditionally independent eQTLs were much more likely to be unobserved in either non-African or African 1000 Genomes ancestries as compared to primary QTLs (P = 9.25 × 10−214 and P = 7.19 × 10−72, respectively; Fig. 4d).
Pan-UKBB GWAS colocalization
To demonstrate the utility of a continental African transcriptome QTL resource for interpreting GWAS, we selected 83 traits where blood is a potentially relevant tissue and performed colocalization analysis with Pan-UK Biobank (Pan-UKBB) GWAS from African-ancestry individuals (Supplementary Table 16)57. Given the relatively modest sample size of these GWAS (a maximum of 6,636 individuals), we performed colocalization analysis for all loci with a suggestive GWAS signal (P < 5 × 10⁻⁶) and a significant QTL (FDR < 5%) at two stringency thresholds (Methods). This resulted in 53 of 83 GWAS traits colocalizing with at least one QTL, and a total of 105 genes colocalizing with at least one GWAS trait, collapsing across QTL types (Supplementary Table 17). Analyzing QTL types independently, at the lenient threshold, 91 eQTLs, 26 sQTLs and 5 ieQTLs showed evidence of colocalization (Fig. 5a). Collapsing by gene and GWAS trait across QTLs, hematological phenotypes had the highest number of colocalizations, followed by gastroenterology, cardiovascular and metabolic traits (Fig. 5b). Annotating the unique set of lead variants across all loci with evidence of colocalization revealed that 13.8% were unobserved and 31.5% had a MAF < 1% in 1000 Genomes European-ancestry individuals (Fig. 5c and Supplementary Table 18).

a, Number of colocalizations per QTL type. b, Number of colocalizations flattening at the gene-level across QTL types and summarizing based on GWAS trait category. c, Number of lead colocalization variants with MAF < 1% in 1000 Genomes continental ancestries. d,e, Locus plot of colocalization between SUSD6 eQTL and lipid disease (d; lead variant rs10140437, PP4 = 0.85), and LPIN1 sQTL and waist circumference (e; rs59909741, PP4 = 1.00). In d and e, SABR QTL is shown on top and GWAS on bottom, and lead variant from colocalization analysis is indicated with rsID and set to reference with LD calculated using 1000 Genomes African-ancestry individuals. Two thresholds for colocalization were used—lenient (red, PP4 > 0.50 and PP4/(posterior probability of colocalization hypothesis three (PP3) + PP4) > 0.80) and strict (blue, PP4 > 0.80). The P values in GWAS and QTL locus plots are two-sided from linear regression models.
Many colocalizing QTLs were not identified in any GTEx tissue but were common in 1000 Genomes African-ancestry individuals, including an eQTL for SUSD6 that colocalized with ICD-defined lipid disease (rs10140437, posterior probability of colocalization hypothesis four (PP4) = 0.85) present at 17.5% frequency (Fig. 5d) and both an eQTL and sQTL for C12orf4 that colocalized with serum phosphate levels (rs116827959, PP4 = 0.94) present at 15.4% (Supplementary Fig. 17). Other colocalizing QTLs were not identified in GTEx whole blood, for example, an sQTL that colocalized with waist circumference (rs59909741, PP4 = 1.00) present at 23.5% frequency (Fig. 5e), or were identified in GTEx whole blood but were orders of magnitude more significant in SABR (Supplementary Fig. 18). This included a stop-gain variant eQTL for CD36 at 11.5% frequency that colocalized with alkaline phosphatase levels (rs3211938, PP4 = 1.00; Supplementary Fig. 18d).
In addition to their utility for interpreting African GWAS, QTL studies from groups with shorter linkage disequilibrium (LD) blocks, such as African ancestries, can be used to better fine-map association signals from groups with longer LD blocks, such as European ancestries25. To demonstrate this, we performed colocalization analysis of SABR eQTLs with a subset of ten multi-ancestry Pan-UKBB GWAS (Supplementary Table 19). We identified 854 eQTL by GWAS colocalizations at the lenient threshold spanning all ten traits tested and 621 genes (Supplementary Table 20). As expected, there were numerous examples of colocalizations where SABR eQTLs had a smaller credible set than the multi-ancestry GWAS and GTEx blood eQTLs (Supplementary Fig. 19).
Discussion
The SABR resource is a small but significant step towards closing the functional genomics gap for global populations. By using a standard approach to data processing and QTL mapping, we have enabled direct comparison of SABR with GTEx, and by making full summary statistics publicly available, it is well placed to become widely used to support genetics research in Africa.
Although SABR does not have the same broad tissue diversity as GTEx, whole blood is an ideal tissue for capturing immune function, which is frequently a target of natural selection and shows differences across populations58. Furthermore, whole blood captures diverse cell types that can be interrogated through deconvolution analysis, which is not true of transformed cells such as fibroblasts or lymphoblastoid cell lines that are commonly used in QTL studies25. While blood is not always a causal tissue for disease, the majority of cis-eQTLs are shared across tissues provided the gene is expressed, and blood eQTL studies have identified increasing numbers of regulatory variants that are active in other tissues29,59.
The SABR resource more extensively explored whole blood as a tissue by analyzing additional deconvoluted cell types compared to previous population-scale studies38. We showed that these additional deconvoluted cell types can capture disease-relevant biology, for example, changes in CD4+ and CD8+ T cell levels during HIV infection, neutrophil and Th2 levels in hypertension, and CD4+ T cell levels in obesity39,40,41,42,43,44,45. However, some changes did not entirely agree with known biology, including a decrease in B and memory B cells associated with asthma, or had complex associations, for example, smoking and opposing CD4+ TCM and TEM associations47,48,49. Given this, it is possible that the deconvolution approach does not accurately capture differences in cell-type subsets. Nonetheless, we showed that cell-type enrichment estimates can identify new associations that are not captured by standard complete blood counts. This supports conducting additional deconvolution studies of whole-blood transcriptomes in global populations to gain further insight into the genetic architecture of immune traits.
There are both opportunities and challenges when conducting QTL studies with genetically diverse cohorts. First, high-pass WGS remains prohibitively expensive at population scale, and suitable reference panels for genotype imputation are often lacking33,60. Here we demonstrated that mid-pass WGS offers a cost-effective alternative that is suitable for QTL studies. We also demonstrated that QTL studies with genetically diverse cohorts map significantly more regulatory variants. For example, SABR mapped 30% more QTLs, accounting for sample size versus GTEx whole blood. Furthermore, despite the smaller sample size, SABR mapped 2.5× the number of conditionally independent eQTLs per gene as compared to GTEx whole blood. The enrichment of eQTLs observed only in African-ancestry individuals in secondary signals suggests that conditional analyses and large sample sizes should be the standard approach for QTL mapping in diverse populations. Finally, QTL resources from populations with shorter haplotype blocks (for example, African ancestry) as compared to European-ancestry individuals can enable better fine-mapping of multi-ancestry GWAS signals, as we and others have shown25.
Even with a limited sample size, we uncovered new cell-type associations with potential health relevance. For example, we identified a locus harboring a missense variant in SLC22A11 present at 11% frequency in SABR and absent in other African continental reference groups associated with a decreased transcriptomic signature for M2 macrophages, an immune cell type important for the resolution of inflammatory disease. Intriguingly, this locus has been associated with gout, an inflammatory response to monosodium urate crystals in joints, in European-ancestry individuals, and M2 macrophages have been proposed to be elevated in chronic gout as a reparative response61,62. SLC22A11 encodes a urate transporter, so the missense variant could impact blood urate levels, gout risk and, thus, M2 macrophage levels, although a gout GWAS in a population where this allele is prevalent would be required to determine this. Another example of a new cell-type association is an intronic variant in CAMK2D with a decreased signature of CD8+ naive T cells. The allele is found at 23% frequency in SABR, 18% in 1000 Genomes African-ancestry and unobserved in non-African ancestries. CaMKII family members have been implicated in regulating CD8+ T cell proliferation, so this association supports known biology63. CD8+ T cells play important roles in clearing infections and cancerous cells, as well as long-term immunity64.
Integrating cell-type GWAS and QTL results also has potential to uncover new disease biology. For example, a stop-gain variant that is unobserved in non-African ancestries was identified as a strong cis-eQTL for NIPSNAP3A. This variant was also nominally associated with increased CD4+ memory T cell levels in cell-type deconvolution analysis (P = 4.68 × 10⁻³), matching the phenotype observed in mouse knockout studies65. This human genetic link suggests that NIPSNAP3A could serve as a target for modifying CD4+ memory T cell levels, which has relevance to autoimmune diseases, cancer and infectious diseases, including HIV/AIDS66,67,68. It is, however, important to recognize that the health relevance of trait associations might differ across populations. This is exemplified by Duffy-null associated neutrophil count, which is phenotypically benign in African-ancestry individuals, demonstrating the importance of conducting clinical and precision medicine studies with under-represented groups52,69.
The most common application of QTL resources is to uncover specific genes and molecular mechanisms underlying genetic associations. By integrating SABR with Pan-UKBB GWAS performed in African-ancestry individuals through colocalization analysis, we identified at least one putative causal gene and mechanism for over 50 traits. This included identifying new trait–gene associations with alleles common in African-ancestry individuals and rare or absent in non-African ancestries. For example, an eQTL for SUSD6 colocalized with lipid disease, and the directionality suggested that lower expression is associated with increased risk. SUSD6 has not previously been nominated as a causal gene for lipid disease; however, the colocalization agrees with observations from mouse studies, where knockout of Susd6 was associated with decreased HDL and increased liver enzyme levels, markers of lipid disease65. Similarly, an sQTL for LPIN1 colocalized with waist circumference. This gene has not been previously associated with body composition traits, but it has a known role in lipid metabolism, and mouse knockout studies have identified multiple lipid and fat distribution phenotypes65,70. Among the strongest evidence for colocalization observed was between a CD36 stop-gain eQTL and alkaline phosphatase levels. Reduced expression of CD36 was associated with decreased alkaline phosphatase levels, indicating that loss of function could be protective in the context of liver disease. Indeed, the stop-gain variant is significantly associated with increased HDL levels (P = 3.00 × 10⁻²⁷), and mouse studies have shown the gene is involved in fatty acid metabolism, with disruption in liver protecting from steatosis and improving lipid profiles71,72.
Studies integrating genetics and omics in diverse populations are becoming increasingly common and include the plasma proteome and metabolome73,74. However, transcriptome studies based on RNA-seq offer breadth and depth in a cost-effective, single assay. Many molecular traits can be quantified from a single data type with applicability to multiple disease areas, as demonstrated by the cell-type deconvolution, expression and splicing analyses in SABR. Future analyses of SABR could include additional molecular phenotypes such as alternative transcription start site usage and polyadenylation using the same data75. While blood is most frequently collected for transcriptome studies, noninvasive or minimally invasive biospecimens could be used in future studies to explore additional biology76.
Given the vast genetic diversity of the African continent, SABR (Southern Africa) and others like the African Functional Genomics Resource (Western and Eastern Africa) are just a small part of the many functional genomic studies that are required25. Developing these resources with the input of participating communities and in a way that benefits them is essential and will contribute to our understanding of diseases with specific relevance to African people77,78,79,80. Together, these will work towards a vision of precision medicine with the potential to improve the health of the 1.5 billion people living on the continent.
Methods
Study design
This study involved recontacting individuals from South Africa who had previously contributed their genetic data to the AWI-Gen study at baseline and enrolling them in the SABR study13,19,30,81. This study was submitted for ethics approval as an independent study and did not include AWI-Gen participants sampled from cohorts in West and East Africa. Phenotype information was previously collected and used during cell-type deconvolution analysis81.
Ethical approval for this study was provided by the Human Research Ethics Committee (Medical) of the University of the Witwatersrand (M210214) and the University of Limpopo Research Ethics Committee (TREC/199/201:IR). The protocol was reviewed by the Variant Bio ethics committee. Individual participants gave voluntary informed consent to participate in the study before taking part.
SABR participant selection
Participant recruitment and sample collection were conducted at the following study centers: (1) the SAMRC/Wits University Rural Public Health and Health Transitions Research Unit, which hosts and operates the Agincourt Health and Socio-Demographic Surveillance System (HDSS), involving Tsonga (also referred to as Shangaan), Xitsonga-speaking individuals; (2) the Developmental Pathways to Health Research Unit (DPHRU) in Soweto, involving Zulu, isiZulu-speaking individuals; and (3) DIMAMO (formerly Dikgale) at the University of Limpopo, involving Pedi or Bapedi, Sepedi-speaking individuals31,32. Recruitment to constitute participants of the multicentre AWI-Gen cohort involved random sampling of equal numbers of adults from the three established population-based cohorts (Agincourt, DIMAMO and DPHRU), hence reflecting the underlying population composition. Participants for recontacting were selected based on their self-reported language group membership and genotype data generated from the H3Africa SNP array in the AWI-Gen study82. Briefly, individuals were selected based on close clustering in principal component analysis with other members of the same group and being minimally related (p̂ < 0.0625). Following community engagement and individual informed consent, we enrolled 750 adult participants from three different South Eastern Bantu-speaking groups (approximately 250 from each group and ~50% women)—Bapedi, Xitsonga and Zulu. For Tsonga and Bapedi groups, only participants for whom all four grandparents lived at the study ___location, or had the same self-reported group membership, were eligible for recruitment (in exceptional circumstances, three such grandparents were considered appropriate). Participation was voluntary, and potential participants were excluded if they chose not to participate after receiving information about the project. Due to the objectives of the study and limited resources, we could not be inclusive of all community members and therefore had to apply specific inclusion criteria: (1) individuals who provided informed consent, (2) individuals whose grandparents (all four or at least three) were identified by the participants as being from the same ethnolinguistic group (Bapedi, Xitsonga or Zulu), (3) exclusion of individuals who were taking any medication that could interfere with the transcriptome analysis or had a condition that could interfere with blood collection and (4) exclusion of individuals who were pregnant or lactating, or are otherwise part of a vulnerable population in the context of this study.
Sample collection and storage
Trained nurses who were supervised and supported by senior staff of each research center collected approximately 6 ml of venous blood in two 3 ml Zymo DNA/RNA shield tubes (R1150) from each participant. Study sites collected and stored samples according to standard operating procedures. Centralized sample storage and processing took place at the Sydney Brenner Institute for Molecular Bioscience at the University of the Witwatersrand in Johannesburg. Laboratory work (DNA and RNA extraction and whole-genome sequencing) took place in the commercial laboratory of Psomagen. The DNA and RNA were destroyed after they had been analyzed in accordance with the informed consent.
Community engagement
Extensive site-specific community engagement was conducted to introduce and explain the proposed study to community leaders and potential participants. Participants were enrolled in the study after providing informed consent. Using established community engagement and information dissemination channels, we engaged community stakeholders through in-person meetings (when possible) at each study center before participants were approached and informed consent sought. In the semirural rapidly transitioning rural context of Agincourt (Mpumalanga) and the peri-urban environment of DIMAMO (Limpopo) Study Centres, we met with community advisory boards of the HDSS Centres in May 2021 to explained what the study was about, how the selection and consenting process would proceed and what benefit sharing would entail for their communities. It was an opportunity to hear their views, respond to their questions and concerns and to adjust our processes in line with their suggestions. We also received feedback on the following issues: (1) how they felt about the project in general and whether they considered that it would be valuable for their communities to participate; (2) whether they felt comfortable with how their data would be used and what would happen to the data, for example, data sharing with the wider scientific community—it was stressed that no individually identifying data would be shared; and (3) how they felt about providing biological samples and disposal and/or repatriation of the samples.
In the urban Soweto study setting, given that this was during the COVID-19 pandemic, our partners interacted with the municipal ward-councilors to explain the study to them and then proceeded with recruitment in line with the processes of the Developmental Pathways for Health Research Unit.
Recruitment started in June 2021 and was completed by November 2021. All three research centers were mindful of taking precautionary measures related to possible infection during the pandemic and used masks and sanitizers during all interactions, with frequent decontamination of transport vehicles (if they were transporting participants) and recruitment study rooms. No adverse events were reported during the recruitment phase.
Once participant recruitment was completed, the community benefit sharing process was put in place and completed by November 2022. This process will be described elsewhere and was in line with the processes developed by Variant Bio77.
Sequencing and data processing
Whole-genome sequencing, joint variant calling and imputation
Whole-blood samples were sent to Psomagen for DNA extraction, library preparation and sequencing. DNA samples were prepped with Illumina DNA Prep library kits and sequenced on NovaSeq 6000 instruments with 2× 151-bp reads targeting a throughput of ~16 Gb per sample, for an expected deduplicated coverage of about 5× per sample. WGS data were then processed with Variant Bio’s in-house pipeline, which includes extensive QC and processing following the GATK Best Practices guidelines (CCDG functional equivalence version)83. GATK version 4.1.4.0 was used up to gvcf production and then GATK 4.2.0.0 for joint genotyping/VQSR. Median coverage among the mid-pass WGS samples was 5.1×, ranging from 4.0× to 18.3× per sample. Following an approach for mid-pass WGS we have previously described, joint genotyping and subsequent imputation were performed across a total of 1,399 genomes by including 100 South African individuals sequenced at high-coverage as part of H3Africa, multiple populations from 1000 Genomes (GBR, YRI, CHB, LWK, GWD, for a total of n = 514 individuals), and various Bantu and San populations from the Human Genome Diversity Project and the Simons Genome Diversity Project (n = 28 individuals)16,17,18,33,34. Before imputation with BEAGLE v5.1, all genotypes with GQ < 18 were filtered (set to missing), as well as variant alleles observed only in a single individual removed84. In a first pass, we only imputed genotypes of variants in Genome In a Bottle (GIAB) high-confidence regions, ensuring high-quality imputation within this stricter set85. After fixing these genotypes, we added variants outside high-confidence regions as well as structural variants (Human Genome Structural Variation Consortium SVs genotyped in all individuals using PanGenie, with GQ < 200 set to missing) and imputed these as well35. Indels in GIAB low-confidence regions were filtered from all downstream analyses.
RNA-seq and expression/splicing quantification
Stranded RNA-seq depleting for globin gene transcripts was performed on RNA extracted from venous whole blood. RNA extraction and sequencing were done at Psomagen. All successfully extracted RNA samples with RIN > 5 and DV200 > 70 were prepped with Illumina TruSeq stranded Total RNA Ribo-Zero Globin Kits. The resulting 669 libraries, which passed library QC, were sequenced on NovaSeq 6000 instruments with 2× 151-bp reads, targeting 9 Gb per sample. Reads were processed with Variant Bio’s in-house pipeline following the GTEx/TOPMed RNA-seq pipeline employing RNA-SeQC (v2.3.6) for gene quantification of collapsed genes (GENCODE v34)86. Splice junction counts were quantified with the GTEx Leafcutter pipeline (without WASP filtering)29,87. Extensive QC was performed including sample identity checks versus the WGS data. A total of 29 samples were removed as a result—19 due to low RNA-seq quality (ribosomal content > 10%, medTIN < 30%, exonic rate < 20% or pct_correct_strand < 90%), 7 due to mismatches between WGS or RNA-seq data and previous array genotypes and 3 that were identified as sequencing duplicates.
Variant annotations
Variants genotyped from whole-genome sequencing were annotated with the following: Variant Effect Predictor using cache version 1.0.8, Combined Annotation-Dependent Depletion using version 1.6 and allele frequencies calculated from high-pass whole-genome sequencing of 1000 Genomes individuals16,88,89. In addition, variants were annotated based on their allele frequencies across populations. When analyzing alleles by ancestry, the minor allele was defined in SABR, and the number of minor alleles observed in each 1000 Genomes continental ancestry (African, American, East Asian, South Asian and European) was counted. In addition, analysis of ‘non-African’ ancestry was carried out by combining East Asian, South Asian and European ancestries, but excluding American ancestry as 1000 Genomes American individuals include those with admixed African ancestry. Those ancestries where the SABR minor allele was unobserved were reported. Finally, we also annotated QTL variants based on whether they were present in eQTLGen full summary statistics by rsID lookup56.
Genotype QC filtering for downstream analyses
Participant-level and variant-level QC metrics derived from genotype data were used to filter inputs for downstream analyses using Hail (v0.2.57). Participant-level exclusion filters included the following: imputation rate > 85% in the final cohort, heterozygosity > 3 s.d. from mean, relatedness (p̂) > 0.0625 and any of PCs 1–5 > 7 s.d. from mean. Variant-level exclusion filters included the following: minor allele count < 10 in final cohort, imputation rate > 75% in final cohort, indels in GIAB low-confidence regions, variants not in Hardy–Weinberg equilibrium (P < 1 × 10⁻¹⁰) and variants not on main autosomes. For QTL analyses, participants were first subset to only those with RNA-seq data passing QC. For genetic analyses, including population allele frequencies of functional variants and xCell GWAS, 724 participants and 22,569,620 variants passed all QC filters. Of the 724 participants, 620 had expression data. For QTL analyses, 614 participants and 17,880,016 variants passed all QC filters.
Principal component analysis
In addition to the variant-level exclusion filters described above, variants were further filtered to include only those with MAF > 5%. For principal component analysis, including reference populations, the Hardy–Weinberg equilibrium filter was not used. Variants were LD pruned using the ld_prune function in Hail with a window size of 50 kb and R2 < 0.2. To calculate principal components, the hwe_normalized_pca() function was used in Hail. Principal components from the analysis of SABR participants alone were used to correct for population structure in downstream analyses.
Cell-type deconvolution
Cell-type deconvolution using xCell
Cell-type deconvolution from bulk blood transcriptome data was performed using the xCell method37. This is the same method extensively benchmarked and used by the GTEx Consortium38. The method produces cell-type enrichment scores, which are useful for ranking the relative enrichment of a given cell type across samples within the cohort; however, the estimate is not directly interpretable or portable across cohorts. This makes the enrichment scores a suitable phenotype for downstream analyses, including GWAS and cell-type interaction QTL analyses, where the data are inverse normal transformed and only the rank within the cohort is relevant. Cell-type enrichments were estimated in a combined cohort of GTEx whole blood alongside SABR samples. This was required to benchmark SABR results against GTEx. xCell produces estimates for a variety of cell types, only some of which are relevant to whole blood. To define the cell types used in downstream analyses, we filtered based on those with an enrichment score >0 in at least 50% of the cohort, and those in the myeloid, lymphoid or hematopoietic stem cell categories (Supplementary Table 3). This resulted in the selection of 40 blood-relevant cell types.
As expected, numerous PEER factors were correlated with cell-type enrichment estimates (Supplementary Fig. 5). PEER factors 1 through 3 were most positively correlated with erythrocytes (ρ = 0.57, P = 4.83 × 10−54), neutrophils (ρ = 0.64, P = 0) and monocytes (ρ = 0.53, P = 0), respectively. Cell-type enrichment estimates were also correlated with age and sex, with platelets showing the expected decrease in men90 (ρ = −0.26, P = 7.78 × 10⁻¹¹).
Modeling deconvoluted cell types in disease
To determine whether changes in enrichment scores of deconvoluted cell types were associated with disease, we modeled six binary traits for which we had data for participants—asthma (n = 32), diabetes (n = 31), HIV infection (n = 130), hypertension (n = 296), obesity (n = 214) and smoking status (n = 200). Diabetes was defined based on a fasting glucose measurement of ≥7 mmol l−1 and obesity was defined based on a body mass index >30 kg m−2. To model cell-type changes, we first residualized xCell enrichment scores on age, sex, age2, sex × age and sex × age2 for each of the 40 cell types. The residuals were inverse normal transformed and used in a logistic regression model of disease ~ cell type, for each cell type. From the model, the effect estimate for cell type (β) and P value for the estimate was reported. P values were adjusted for multiple testing across all cell types by disease comparisons using the FDR method. Effect estimates across all comparisons were used to generate a heatmap and perform unsupervised clustering of cell types and diseases.
Some of the observed cell type changes did not entirely agree with known biology or had complex associations. Given this, it is possible that the deconvolution approach does not accurately capture differences in cell-type subsets. Alternatively, this could be explained by environmental differences in SABR versus other studies. Another important limitation is that estimates for many cell types have not been validated, and the method cannot differentiate between gene expression signatures and actual cell counts.
GWAS of cell-type enrichment scores
For blood-relevant cell types, inverse normal transformed xCell enrichment scores were used for GWAS with the following covariates: sex, age, age2, sex × age, sex × age2, mean whole-genome sequencing depth and genetic principal components 1–20. A total of 620 participants were included in the GWAS. All variants with minor allele count ≥12 were included in the GWAS. GWAS were run using the linear_regression_rows() function in Hail (v0.2.57). For each GWAS, genomic inflation was calculated using lambda gc (λgc) and all GWAS had 0.95 < λgc < 1.05. For each association, Open Targets was queried to determine whether the locus contained any associations with blood cell counts and whether the lead variant was associated with blood cell counts. To identify locus associations, the nearest gene to the lead SABR GWAS variant was queried in Open Targets and associations with genetics score > 0 were reported. To identify variant associations, the lead SABR GWAS variant was queried in Open Targets and associations with P < 1 × 10⁻⁶ were reported. Mean corpuscular hemoglobin was included in addition to cell counts for comparison to erythrocyte cell signatures.
QTL mapping
Cis-QTL mapping
To maximize compatibility with the largest existing QTL resource, the v8 cis-QTL mapping pipeline developed by the GTEx Consortium was used86. For eQTLs, genes with ≥0.1 TPM in ≥20% samples and ≥6 reads (unnormalized) in ≥20% samples were included. Gene expression values calculated using TMM were inverse normal transformed and used as phenotypes for QTL mapping. QTL mapping was performed using fastQTL in a ±1-Mb window from the gene TSS with between 1,000 and 10,000 permutations per gene91. Variants with minor allele count ≥10 corresponding to a MAF ≥ 0.81% were included. Age, sex, genetic principal components 1–20, mean whole-genome sequencing depth and 60 PEER factors inferred from the RNA-seq data were included as covariates36. The top permutation-derived P values per gene were corrected for multiple testing using Storey’s q value and significance was defined at FDR < 5% (ref. 92). For sQTLs, a strategy similar to eQTLs was used. Intron clusters to be included in QTL mapping were defined using the same thresholds as in GTEx v8. The intron usage phenotypes were inverse normal transformed and fastQTL was run in the grouped permutation mode with the ‘--grp’ argument, grouping by the gene each splice event mapped to. PEER factors were inferred from the splice qualifications and 15 were included as covariates, alongside the same covariates as the eQTL mapping. While multiple sQTLs (corresponding to different splicing clusters) were mapped per gene, only the top, most significant sQTL was reported. For downstream analyses, the nominal significance threshold established by permutation mapping could be used to identify sQTLs in addition to the most significant cluster. Multiple testing correction was performed across all genes using the same approach as eQTLs.
eQTLs were mapped in each of the three SEB groups independently and jointly. The joint approach yielded the highest number of eVariants that were rare in at least one of the three groups (MAF < 1%) and the highest estimated number of true positives (Storey’s π1 = 0.86), and contained the vast majority of genes with a significant eQTL (eGenes) mapped across all four approaches (14,191 of 14,750 = 96%; Supplementary Fig. 8 and Supplementary Table 6), so this approach was used for all subsequent analyses, including for sQTL mapping.
PEER factors were correlated with known biological and technical variables (RNA-seq PEER factors—Supplementary Methods). The number of PEER factors used as covariates for eQTL (60) and sQTL (15) mapping was selected to match the GTEx Consortium. The GTEx Consortium systematically tested the impact of PEER factors as covariates for QTL mapping as a function of sample size. For eQTLs, they determined that 60 PEER factors optimized discovery for sample sizes ≥350. For sQTLs, they determined that discovery did not significantly improve after the addition of 15 PEERs, so this was their guidance for sQTL mapping regardless of sample size. We used 20 Genotype PCs as covariates for QTL mapping based on the amount of variance explained by the PCs (Genotype PCs in QTL mapping—Supplementary Methods). GTEx v8 whole blood summary statistics and QTLs were used for replication analysis (GTEx cis-QTL replication analysis—Supplementary Methods). The numbers of tested and significant genes (excluding chrX) in GTEx were determined by downloading the GTEx_Analysis_v8_eQTL.tar and GTEx_Analysis_v8_sQTL.tar files from the GTEx portal93 rather than the 2020 Science publication.
Independent cis-eQTL mapping
To map independent cis-eQTLs, a stepwise conditional analysis approach was used. Briefly, for each significant eGene (FDR < 5%), the top eVariant was included as a covariate and the regression was rerun for all variants within the cis window. If the variant with the lowest P value in the step met the gene-level nominal significance threshold determined by permutation mapping, it was considered conditionally independent and included along with the preceding variant as a covariate in another round of regression. Subsequent steps were performed until no variant met the permutation mapping nominal significance threshold, up to a maximum of 20 steps. For each gene, the number of conditionally independent signals and the top variants from each step were reported.
Cis-ieQTL mapping
A similar ieQTL mapping approach as ref. 38 was used to map interaction eQTLs from xCell enrichment estimates. Briefly, xCell enrichment scores were inverse normal transformed, variants meeting a MAF cutoff in both the top and bottom half of the normalized xCell distribution were tested and the same PEER factors as for cis-eQTL mapping were used as covariates. A nominal pass for interaction mapping was performed with fastQTL using the ‘--interaction’ argument. Gene-level multiple testing correction was performed using eigenMT to estimate the number of independent tests per gene, and then, the top variant was selected and its nominal P value corrected using Bonferroni correction94. The Bonferroni-corrected top variant P values were then corrected across all genes using the Benjamini–Hochberg (FDR) approach. We benchmarked the impact of various parameters on ieQTL mapping for neutrophils (cis-ieQTL neutrophil benchmarking—Supplementary Methods).
Cis-ieQTL replication analysis
Due to a lack of full summary statistics available from ref. 38, we were not able to test SABR neutrophil ieQTLs for replication in GTEx whole blood. However, we were able to test 829 significant GTEx neutrophil ieQTLs (FDR < 5%) for replication in SABR with MAF > 5% in both cohorts. A notable caveat is the very different LD structure between the cohorts, with likely overall shorter haplotypes in SABR versus GTEx due to African ancestry. This would be expected to lower replication of GTEx ieQTLs in SABR, but not vice versa. Despite this, we observed significant correlation in the interaction term β values (Spearman ρ = 0.18, P = 4.40 × 10⁻⁶) and moderate evidence of replication (Storey’s π1 = 0.30) for 622 GTEx neutrophil ieQTLs at a more stringent significance threshold FDR < 1%. To further analyze replication, we split the top 800 GTEx ieQTLs that could be analyzed for replication into quartiles by P value and found strong replication of the top quartile (most significant ieQTLs in GTEx, π1 = 0.65), moderate replication of the second quartile (0.21) and weak replication of the bottom two quartiles (Supplementary Fig. 16). We also intersected the set of significant ieGenes discovered in SABR with GTEx (FDR < 5%) and found that 37 of 97 were significant in both studies. To determine whether the overlapping ieGenes constituted the same ieQTL signal, we calculated LD between the top SABR ieVariant and GTEx ieVariant for each overlapping gene using high-coverage 1000 Genomes European and African-ancestry data. Of the 33 ieGenes where LD could be calculated, SABR and GTEx ieVariants were in LD (r2 > 0.80) for 19, suggesting the same ieQTL signal was mapped in both cohorts.
In addition, we tested the ieQTLs mapped in SABR for replication in eQTL studies from purified cells. This was done for the xCell types with sufficient numbers of ieQTLs and where we could identify studies with matching cell types in the catalog of harmonized eQTL studies55. In total, we tested six xCell ieQTL cell types for replication in cell-type-specific bulk RNA studies (cis-ieQTL replication in purified cell datasets—Supplementary Methods).
Colocalization analysis
Pan-UKBB GWAS summary statistics in GRCh38 coordinates from African-ancestry individuals (XX_AFR) and multi-ancestry analyses were downloaded from the Broad Institute95. The full path to the summary statistics for each of the GWAS used for colocalization is listed under path_sumstats in Supplementary Table 16 (African ancestry) and Supplementary Table 19 (multi-ancestry). Colocalization analysis was performed using the coloc R package (version 5) under a single causal variant assumption with variant MAFs and P values as inputs96. Loci were selected for colocalization based on having a GWAS variant with P < 5 × 10⁻⁶ (African ancestry) or P < 5 × 10⁻⁸ (multi-ancestry) within ±500 kb from the lead QTL variant, for all significant QTLs (FDR < 5%). Two thresholds for colocalization were used to capture the maximum number of putative colocalizations—lenient, PP4 > 0.50 and PP4/(PP3 + PP4) > 0.80; strict, PP4 > 0.80.
Reporting summary
Further information on research design is available in the Nature Portfolio Reporting Summary linked to this article.
Data availability
Academic researchers can apply for access to individual-level genotype and transcriptome data through the European Genome-Phenome Archive (EGAS50000001008). Cell-type deconvolution GWAS with genome-wide significant associations are available on the NHGRI-EBI GWAS Catalog (GCP001167). Full GWAS and QTL summary statistics are available in a publicly accessible AWS S3 bucket (s3://public.us-prod.variantbio.com/SABR/) and in Zenodo (https://doi.org/10.5281/zenodo.15334125)97. All gene-level and annotated summary information for QTLs are included as supplementary tables in this manuscript. All data are made available for non-commercial use only.
Code availability
Data tables and scripts used in this analysis are available on GitHub (https://github.com/variant-bio/SABR) and Zenodo (https://doi.org/10.5281/zenodo.15334125)97.
References
Uffelmann, E. et al. Genome-wide association studies. Nat. Rev. Methods Primers 1, 59 (2021).
Minikel, E. V., Painter, J. L., Dong, C. C. & Nelson, M. R. Refining the impact of genetic evidence on clinical success. Nature 629, 624–629 (2024).
Maurano, M. T. et al. Systematic localization of common disease-associated variation in regulatory DNA. Science 337, 1190–1195 (2012).
Lappalainen, T., Li, Y. I., Ramachandran, S. & Gusev, A. Genetic and molecular architecture of complex traits. Cell 187, 1059–1075 (2024).
Gamazon, E. R. et al. Using an atlas of gene regulation across 44 human tissues to inform complex disease- and trait-associated variation. Nat. Genet. 50, 956–967 (2018).
Yao, D. W., O’Connor, L. J., Price, A. L. & Gusev, A. Quantifying genetic effects on disease mediated by assayed gene expression levels. Nat. Genet. 52, 626–633 (2020).
Mostafavi, H., Spence, J. P., Naqvi, S. & Pritchard, J. K. Systematic differences in discovery of genetic effects on gene expression and complex traits. Nat. Genet. 55, 1866–1875 (2023).
Mills, M. C. & Rahal, C. The GWAS Diversity Monitor tracks diversity by disease in real time. Nat. Genet. 52, 242–243 (2020).
George, S. H. L., Medina-Rivera, A., Idaghdour, Y., Lappalainen, T. & Gallego Romero, I. Increasing diversity of functional genetics studies to advance biological discovery and human health. Am. J. Hum. Genet. 110, 1996–2002 (2023).
Ramsay, M. African genomic data sharing and the struggle for equitable benefit. Patterns 3, 100412 (2022).
Omotoso, O. E. et al. Bridging the genomic data gap in Africa: implications for global disease burdens. Glob. Health 18, 103 (2022).
Lumaka, A. et al. Increasing African genomic data generation and sharing to resolve rare and undiagnosed diseases in Africa: a call-to-action by the H3Africa rare diseases working group. Orphanet J. Rare Dis. 17, 230 (2022).
Sengupta, D. et al. Genetic substructure and complex demographic history of South African Bantu speakers. Nat. Commun. 12, 2080 (2021).
Choudhury, A. et al. High-depth African genomes inform human migration and health. Nature 586, 741–748 (2020).
Bird, N. et al. Dense sampling of ethnic groups within African countries reveals fine-scale genetic structure and extensive historical admixture. Sci. Adv. 9, eabq2616 (2023).
Byrska-Bishop, M. et al. High-coverage whole-genome sequencing of the expanded 1000 Genomes Project cohort including 602 trios. Cell 185, 3426–3440 (2022).
Mallick, S. et al. The Simons Genome Diversity Project: 300 genomes from 142 diverse populations. Nature 538, 201–206 (2016).
Bergström, A. et al. Insights into human genetic variation and population history from 929 diverse genomes. Science 367, eaay5012 (2020).
Choudhury, A. et al. Meta-analysis of sub-Saharan African studies provides insights into genetic architecture of lipid traits. Nat. Commun. 13, 2578 (2022).
Brandenburg, J.-T. et al. Genetic association and transferability for urinary albumin-creatinine ratio as a marker of kidney function in four sub-Saharan African populations and non-continental individuals of African ancestry. Front. Genet. https://doi.org/10.3389/fgene.2024.1372042 (2024).
McLaren, P. J. et al. Africa-specific human genetic variation near CHD1L associates with HIV-1 load. Nature 620, 1025–1030 (2023).
Chen, W. C. et al. Genome-wide association study of esophageal squamous cell cancer identifies shared and distinct risk variants in African and Chinese populations. Am. J. Hum. Genet. 110, 1690–1703 (2023).
Hamid, I. et al. Mid-pass whole-genome sequencing in a Malagasy cohort uncovers body composition associations. HGG Adv. 5, 100343 (2024).
Lappalainen, T. et al. Transcriptome and genome sequencing uncovers functional variation in humans. Nature 501, 506–511 (2013).
DeGorter, M. K. et al. Transcriptomics and chromatin accessibility in multiple African population samples. Preprint at bioRxiv https://doi.org/10.1101/2023.11.04.564839 (2023).
Kelly, D. E. et al. The genetic and evolutionary basis of gene expression variation in East Africans. Genome Biol. 24, 35 (2023).
Swart, Y. et al. Cis-eQTL mapping of TB-T2D comorbidity elucidates the involvement of African ancestry in TB susceptibility. Preprint at bioRxiv https://doi.org/10.1101/2022.10.19.512814 (2022).
Doughan, A., Adingo, W. & Salifu, S. P. RNA-seq research landscape in Africa: systematic review reveals disparities and opportunities. Eur. J. Med. Res. 28, 244 (2023).
GTEx Consortium. The GTEx Consortium atlas of genetic regulatory effects across human tissues. Science 369, 1318–1330 (2020).
Ramsay, M. et al. H3Africa AWI-Gen Collaborative Centre: a resource to study the interplay between genomic and environmental risk factors for cardiometabolic diseases in four sub-Saharan African countries. Glob. Health Epidemiol. Genom. 1, e20 (2016).
Kahn, K. et al. Profile: Agincourt health and socio-demographic surveillance system. Int. J. Epidemiol. 41, 988–1001 (2012).
Alberts, M. et al. Health & Demographic Surveillance System profile: the Dikgale Health and Demographic Surveillance System. Int. J. Epidemiol. 44, 1565–1571 (2015).
Emde, A.-K. et al. Mid-pass whole genome sequencing enables biomedical genetic studies of diverse populations. BMC Genomics 22, 666 (2021).
Sengupta, D. et al. Performance and accuracy evaluation of reference panels for genotype imputation in sub-Saharan African populations. Cell Genom. 3, 100332 (2023).
Ebler, J. et al. Pangenome-based genome inference allows efficient and accurate genotyping across a wide spectrum of variant classes. Nat. Genet. 54, 518–525 (2022).
Stegle, O., Parts, L., Piipari, M., Winn, J. & Durbin, R. Using probabilistic estimation of expression residuals (PEER) to obtain increased power and interpretability of gene expression analyses. Nat. Protoc. 7, 500–507 (2012).
Aran, D., Hu, Z. & Butte, A. J. xCell: digitally portraying the tissue cellular heterogeneity landscape. Genome Biol. 18, 220 (2017).
Kim-Hellmuth, S. et al. Cell type-specific genetic regulation of gene expression across human tissues. Science 369, eaaz8528 (2020).
Cao, W., Mehraj, V., Kaufmann, D. E., Li, T. & Routy, J.-P. Elevation and persistence of CD8 T-cells in HIV infection: the Achilles heel in the ART era. J. Int. AIDS Soc. 19, 20697 (2016).
Meddows-Taylor, S., Shalekoff, S., Kuhn, L., Gray, G. E. & Tiemessen, C. T. Development of a whole blood intracellular cytokine staining assay for mapping CD4+ and CD8+ T-cell responses across the HIV-1 genome. J. Virol. Methods 144, 115–121 (2007).
Tiemessen, C. T. et al. Natural killer cells that respond to human immunodeficiency virus type 1 (HIV‐1) peptides are associated with control of HIV‐1 infection. J. Infect. Dis. 202, 1444–1453 (2010).
Araos, P., Figueroa, S. & Amador, C. A. The role of neutrophils in hypertension. Int. J. Mol. Sci. 21, 8536 (2020).
Ji, Q. et al. Circulating Th1, Th2, and Th17 levels in hypertensive patients. Dis. Markers 2017, 7146290 (2017).
Zhao, Y. et al. CD4+ T cells in obesity and obesity-associated diseases. Cell. Immunol. 332, 1–6 (2018).
Van der Weerd, K. et al. Morbidly obese human subjects have increased peripheral blood CD4+ T cells with skewing toward a Treg- and Th2-dominated phenotype. Diabetes 61, 401–408 (2012).
Soedono, S. & Cho, K. W. Adipose tissue dendritic cells: critical regulators of obesity-induced inflammation and insulin resistance. Int. J. Mol. Sci. 22, 8666 (2021).
Tejero, J. D. et al. Cigarette smoke extract acts directly on CD4 T cells to enhance Th1 polarization and reduce memory potential. Cell. Immunol. 331, 121–129 (2018).
Qiu, F. et al. Impacts of cigarette smoking on immune responsiveness: up and down or upside down? Oncotarget 8, 268–284 (2017).
Habener, A. et al. IgA+ memory B-cells are significantly increased in patients with asthma and small airway dysfunction. Eur. Respir. J. 60, 2102130 (2022).
Smith, D. et al. A rare IL33 loss-of-function mutation reduces blood eosinophil counts and protects from asthma. PLoS Genet. 13, e1006659 (2017).
Wechsler, M. E. et al. Efficacy and safety of itepekimab in patients with moderate-to-severe asthma. N. Engl. J. Med. 385, 1656–1668 (2021).
Merz, L. E. et al. Absolute neutrophil count by Duffy status among healthy Black and African American adults. Blood Adv. 7, 317–320 (2023).
Vuckovic, D. et al. The polygenic and monogenic basis of blood traits and diseases. Cell 182, 1214–1231 (2020).
Ochoa, D. et al. Open Targets Platform: supporting systematic drug-target identification and prioritisation. Nucleic Acids Res. 49, D1302–D1310 (2021).
Kerimov, N. et al. A compendium of uniformly processed human gene expression and splicing quantitative trait loci. Nat. Genet. 53, 1290–1299 (2021).
Võsa, U. et al. Large-scale cis- and trans-eQTL analyses identify thousands of genetic loci and polygenic scores that regulate blood gene expression. Nat. Genet. 53, 1300–1310 (2021).
Karczewski, K. J. et al. Pan-UK Biobank GWAS improves discovery, analysis of genetic architecture, and resolution into ancestry-enriched effects. Preprint at bioRxiv https://doi.org/10.1101/2024.03.13.24303864 (2024).
Fan, S., Hansen, M. E. B., Lo, Y. & Tishkoff, S. A. Going global by adapting local: a review of recent human adaptation. Science 354, 54–59 (2016).
Brown, A. A. et al. Genetic analysis of blood molecular phenotypes reveals common properties in the regulatory networks affecting complex traits. Nat. Commun. 14, 5062 (2023).
Martin, A. R. et al. Low-coverage sequencing cost-effectively detects known and novel variation in underrepresented populations. Am. J. Hum. Genet. 108, 656–668 (2021).
Sandoval-Plata, G., Morgan, K. & Abhishek, A. Variants in urate transporters, ADH1B, GCKR and MEPE genes associate with transition from asymptomatic hyperuricaemia to gout: results of the first gout versus asymptomatic hyperuricaemia GWAS in Caucasians using data from the UK Biobank. Ann. Rheum. Dis. 80, 1220–1226 (2021).
Jeong, J. H. et al. CD14+ cells with the phenotype of infiltrated monocytes consist of distinct populations characterized by anti-inflammatory as well as pro-inflammatory activity in gouty arthritis. Front. Immunol. 8, 1260 (2017).
Lin, M. Y., Zal, T., Ch’en, I. L., Gascoigne, N. R. J. & Hedrick, S. M. A pivotal role for the multifunctional calcium/calmodulin-dependent protein kinase II in T cells: from activation to unresponsiveness. J. Immunol. 174, 5583–5592 (2005).
Reina-Campos, M., Scharping, N. E. & Goldrath, A. W. CD8+ T cell metabolism in infection and cancer. Nat. Rev. Immunol. 21, 718–738 (2021).
Dickinson, M. E. et al. High-throughput discovery of novel developmental phenotypes. Nature 537, 508–514 (2016).
Autran, B. et al. Positive effects of combined antiretroviral therapy on CD4+ T cell homeostasis and function in advanced HIV disease. Science 277, 112–116 (1997).
Tay, R. E., Richardson, E. K. & Toh, H. C. Revisiting the role of CD4+ T cells in cancer immunotherapy-new insights into old paradigms. Cancer Gene Ther. 28, 5–17 (2021).
Raphael, I., Joern, R. R. & Forsthuber, T. G. Memory CD4+ T cells in immunity and autoimmune diseases. Cells 9, 531 (2020).
Pereira, L., Mutesa, L., Tindana, P. & Ramsay, M. African genetic diversity and adaptation inform a precision medicine agenda. Nat. Rev. Genet. 22, 284–306 (2021).
Reue, K. & Dwyer, J. R. Lipin proteins and metabolic homeostasis. J. Lipid Res. 50, S109–S114 (2009).
Klarin, D. et al. Genetics of blood lipids among ~300,000 multi-ethnic participants of the Million Veteran Program. Nat. Genet. 50, 1514–1523 (2018).
Wilson, C. G. et al. Hepatocyte-specific disruption of CD36 attenuates fatty liver and improves insulin sensitivity in HFD-fed mice. Endocrinology 157, 570–585 (2016).
Sun, B. B. et al. Plasma proteomic associations with genetics and health in the UK Biobank. Nature 622, 329–338 (2023).
Tahir, U. A. et al. Whole genome association study of the plasma metabolome identifies metabolites linked to cardiometabolic disease in Black individuals. Nat. Commun. 13, 4923 (2022).
Mittleman, B. E. et al. Alternative polyadenylation mediates genetic regulation of gene expression. eLife 9, e57492 (2020).
Martorella, M. et al. Evaluation of noninvasive biospecimens for transcriptome studies. BMC Genomics 24, 790 (2023).
Von Baeyer, S. L. et al. Why community consultation matters in genomic research benefit-sharing models. Genome Res. 34, 1–6 (2024).
Tindana, P. et al. Seeking consent to genetic and genomic research in a rural Ghanaian setting: a qualitative study of the MalariaGEN experience. BMC Med. Ethics 13, 15 (2012).
De Vries, J. et al. The H3Africa policy framework: negotiating fairness in genomics. Trends Genet. 31, 117–119 (2015).
Von Baeyer, S. L. et al. Nothing about us without us: sharing results with communities that provide genomic data. Cell 187, 5483–5489 (2024).
Ali, S. A. et al. Genomic and environmental risk factors for cardiometabolic diseases in Africa: methods used for phase 1 of the AWI-Gen population cross-sectional study. Glob. Health Action 11, 1507133 (2018).
H3ABioNet. H3Africa genotyping chip. www.h3abionet.org/h3africa-chip (2021).
Regier, A. A. et al. Functional equivalence of genome sequencing analysis pipelines enables harmonized variant calling across human genetics projects. Nat. Commun. 9, 4038 (2018).
Browning, B. L., Tian, X., Zhou, Y. & Browning, S. R. Fast two-stage phasing of large-scale sequence data. Am. J. Hum. Genet. 108, 1880–1890 (2021).
Dwarshuis, N. et al. The GIAB genomic stratifications resource for human reference genomes. Nat. Commun. 15, 9029 (2024).
Analysis pipelines for the GTEx Consortium and TOPMed. GitHub https://github.com/broadinstitute/gtex-pipeline/ (2020).
Li, Y. I. et al. Annotation-free quantification of RNA splicing using LeafCutter. Nat. Genet. 50, 151–158 (2018).
McLaren, W. et al. The Ensembl Variant Effect Predictor. Genome Biol. 17, 122 (2016).
Rentzsch, P., Schubach, M., Shendure, J. & Kircher, M. CADD-splice-improving genome-wide variant effect prediction using deep learning-derived splice scores. Genome Med. 13, 31 (2021).
Ranucci, M. et al. Gender-based differences in platelet function and platelet reactivity to P2Y12 inhibitors. PLoS ONE 14, e0225771 (2019).
Ongen, H., Buil, A., Brown, A. A., Dermitzakis, E. T. & Delaneau, O. Fast and efficient QTL mapper for thousands of molecular phenotypes. Bioinformatics 32, 1479–1485 (2016).
Storey, J. D. & Tibshirani, R. Statistical significance for genomewide studies. Proc. Natl Acad. Sci. USA 100, 9440–9445 (2003).
GTEx Portal (Broad Institute of MIT and Harvard, accessed June 2023); https://gtexportal.org/home/downloads/adult-gtex/qtl
Davis, J. R. et al. An efficient multiple-testing adjustment for eQTL studies that accounts for linkage disequilibrium between variants. Am. J. Hum. Genet. 98, 216–224 (2016).
Pan-ancestry genetic analysis of the UK Biobank. (Pan UKBB Team, accessed 10 November 2023); pan.ukbb.broadinstitute.org/
Wallace, C. A more accurate method for colocalisation analysis allowing for multiple causal variants. PLoS Genet. 17, e1009440 (2021).
Castel, S. South African Blood Regulatory (SABR) resource. Zenodo https://doi.org/10.5281/zenodo.15334125 (2025).
Acknowledgements
We acknowledge the generosity of the participants who shared information, provided blood samples and gave us permission to use and share their data widely with the research community. The community engagement and benefit sharing activities were enabled through the extraordinary efforts of the following people at each of the Research Centres: Jackson Mabasa (DPHRU), Simon Khoza (SAMRC/Wits Agincourt Unit) and Mmalehlokoana Maria Manabile (DIMAMO). The AWI-Gen Collaborative Centre that contributed foundational data for this study was funded by the National Institutes of Health (U54HG006938) and the South African Department of Science and Innovation (DST/CON 0056/2014). The MRC/Wits Rural Public Health and Health Transitions Research Unit and Agincourt Health and Socio-Demographic Surveillance System, a node of the South African Population Research Infrastructure Network, is supported by the Department of Science and Innovation, the University of the Witwatersrand and the Medical Research Council, South Africa, and previously the Wellcome Trust, UK (grants 058893/Z/99/A, 069683/Z/02/Z, 085477/Z/08/Z and 085477/B/08/Z). M.R. holds the South Africa Research Chair on Genomics and Bioinformatics of African Populations, supported by the National Research Foundation of South Africa (89646). This work represents the views of the authors and does not necessarily reflect the views of the funders. It has enabled securing additional National Institutes of Health funding (U01HL172182) for a project led by A.C. and titled ‘Integrated Models for Early Risk-prediction in Africa’. D.S. and A.C. were supported by the U.S. National Heart, Lung, and Blood Institute, National Institutes of Health (U01HL172182) under the Harnessing Data Science for Health Discovery and Innovation in Africa (DS-I Africa) program.
Author information
Authors and Affiliations
Contributions
M.R., K.A.W., F.D.T., S.E.C., E.E.B. and M.H. designed the study. The Agincourt HDSS, managed by the SAMRC/Wits University Rural Public Health and Health Transitions Research Unit, is led by S.T., F.X.G.-O., C.K. and K.K., and S.S.R.C. and R.G.M. (DIMAMO), along with L.K.M. (DPHRU), were responsible for managing the community engagement, participant enrollment, blood sampling and processing. Biobanking was overseen by N.S. and F.D.T., while F.D.T., N.S., S.L.v.B., E.E.B. and P.T.M. carried out the study. S.E.C., A.-K.E., M.K., D.S., O.A.G., S.K., K.-D.H.N., A.C., S.H. and L.Y.-A. performed data analysis. S.E.C., M.R. and L.Y.-A. drafted the manuscript, and all authors contributed to writing and reviewing the manuscript.
Corresponding authors
Ethics declarations
Competing interests
S.E.C., A.K.-E., M.K., O.A.G., M.H., S.L.v.B., E.E.B., S.K., K.-D.H.N., K.A.W. and L.Y.-A. were or are employees and/or equity owners at Variant Bio. All other authors declare no competing interests.
Peer review
Peer review information
Nature Genetics thanks Youssef Idaghdour, Guillaume Lettre, and the other, anonymous, reviewer(s) for their contribution to the peer review of this work.
Additional information
Publisher’s note Springer Nature remains neutral with regard to jurisdictional claims in published maps and institutional affiliations.
Supplementary information
Supplementary Information
Supplementary Figs. 1–19 and Supplementary Methods.
Supplementary Tables
Supplementary Tables 1–20.
Rights and permissions
Open Access This article is licensed under a Creative Commons Attribution-NonCommercial-NoDerivatives 4.0 International License, which permits any non-commercial use, sharing, distribution and reproduction in any medium or format, as long as you give appropriate credit to the original author(s) and the source, provide a link to the Creative Commons licence, and indicate if you modified the licensed material. You do not have permission under this licence to share adapted material derived from this article or parts of it. The images or other third party material in this article are included in the article’s Creative Commons licence, unless indicated otherwise in a credit line to the material. If material is not included in the article’s Creative Commons licence and your intended use is not permitted by statutory regulation or exceeds the permitted use, you will need to obtain permission directly from the copyright holder. To view a copy of this licence, visit http://creativecommons.org/licenses/by-nc-nd/4.0/.
About this article

Cite this article
Castel, S.E., Tluway, F.D., Emde, AK. et al. A map of blood regulatory variation in South Africans enables GWAS interpretation. Nat Genet (2025). https://doi.org/10.1038/s41588-025-02223-0
Received:
Accepted:
Published:
DOI: https://doi.org/10.1038/s41588-025-02223-0
