
Fig. 4: Morphological features contributing to HECTOR risk scores.
From: Prediction of recurrence risk in endometrial cancer with multimodal deep learning
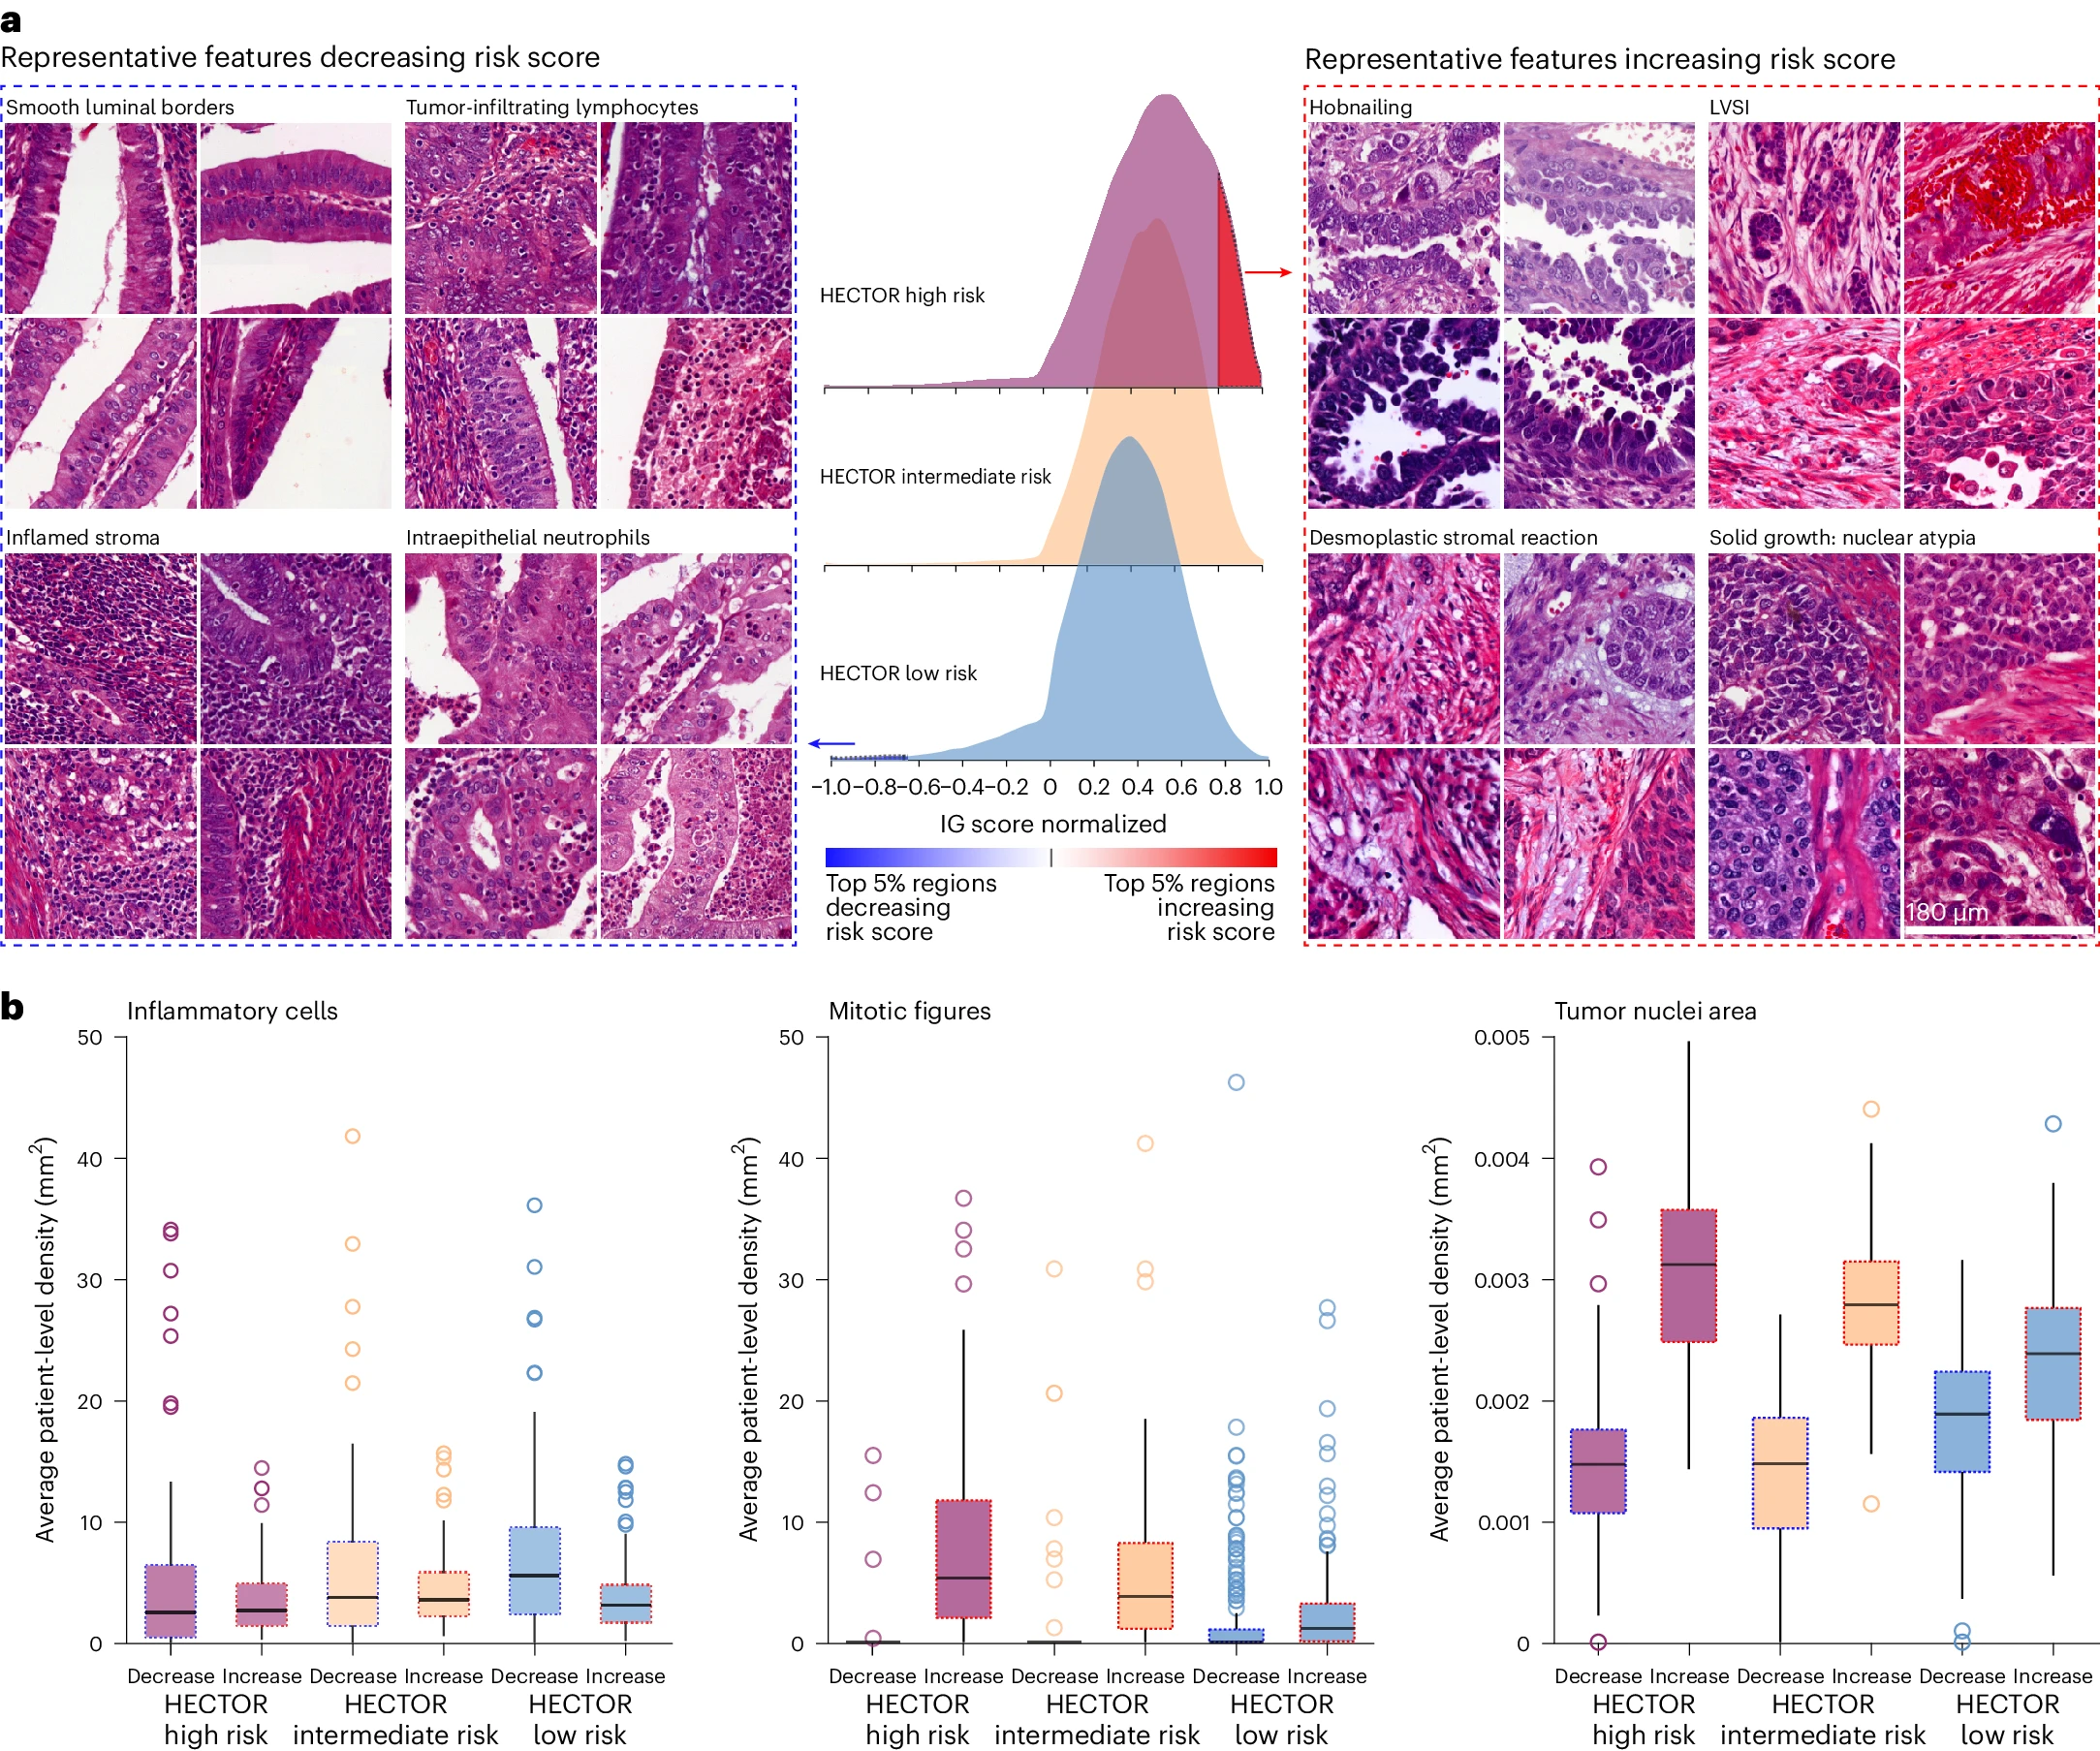
a, The top 5% of the regions increasing and decreasing the risk score, from the IG method63, extracted for qualitative review and quantitative analysis. A representative selection of four patches for each morphological subtype (each selected from a different patient) showed the increasing risk score in the HECTOR high-risk group (right). A representative selection of four patches for each morphological subtype (each selected from a different patient) showed the decreasing risk score in the HECTOR low-risk group (left). Each patch is 180 × 180 μm2. b, Among the top 5% regions, decreasing and increasing the risk score, inflammatory cells, mitotic figures and the tumor nuclei area detected and computed with DL-based image analysis tools14,64. The average by patient is reported in the internal test set (n = 353). The box plots are defined by the center tick as the median value, the lower and upper parts of the box Q1 and Q3 quartiles, respectively, and the bounds of whiskers are (Q1 − 1.5 × IQR, Q3 + 1.5 × IQR). Any outlier points beyond the whiskers are displayed with point marks.
