
Fig. 5: Genomic and transcriptomic correlations of HECTOR risk groups using TCGA-UCEC (n = 381).
From: Prediction of recurrence risk in endometrial cancer with multimodal deep learning
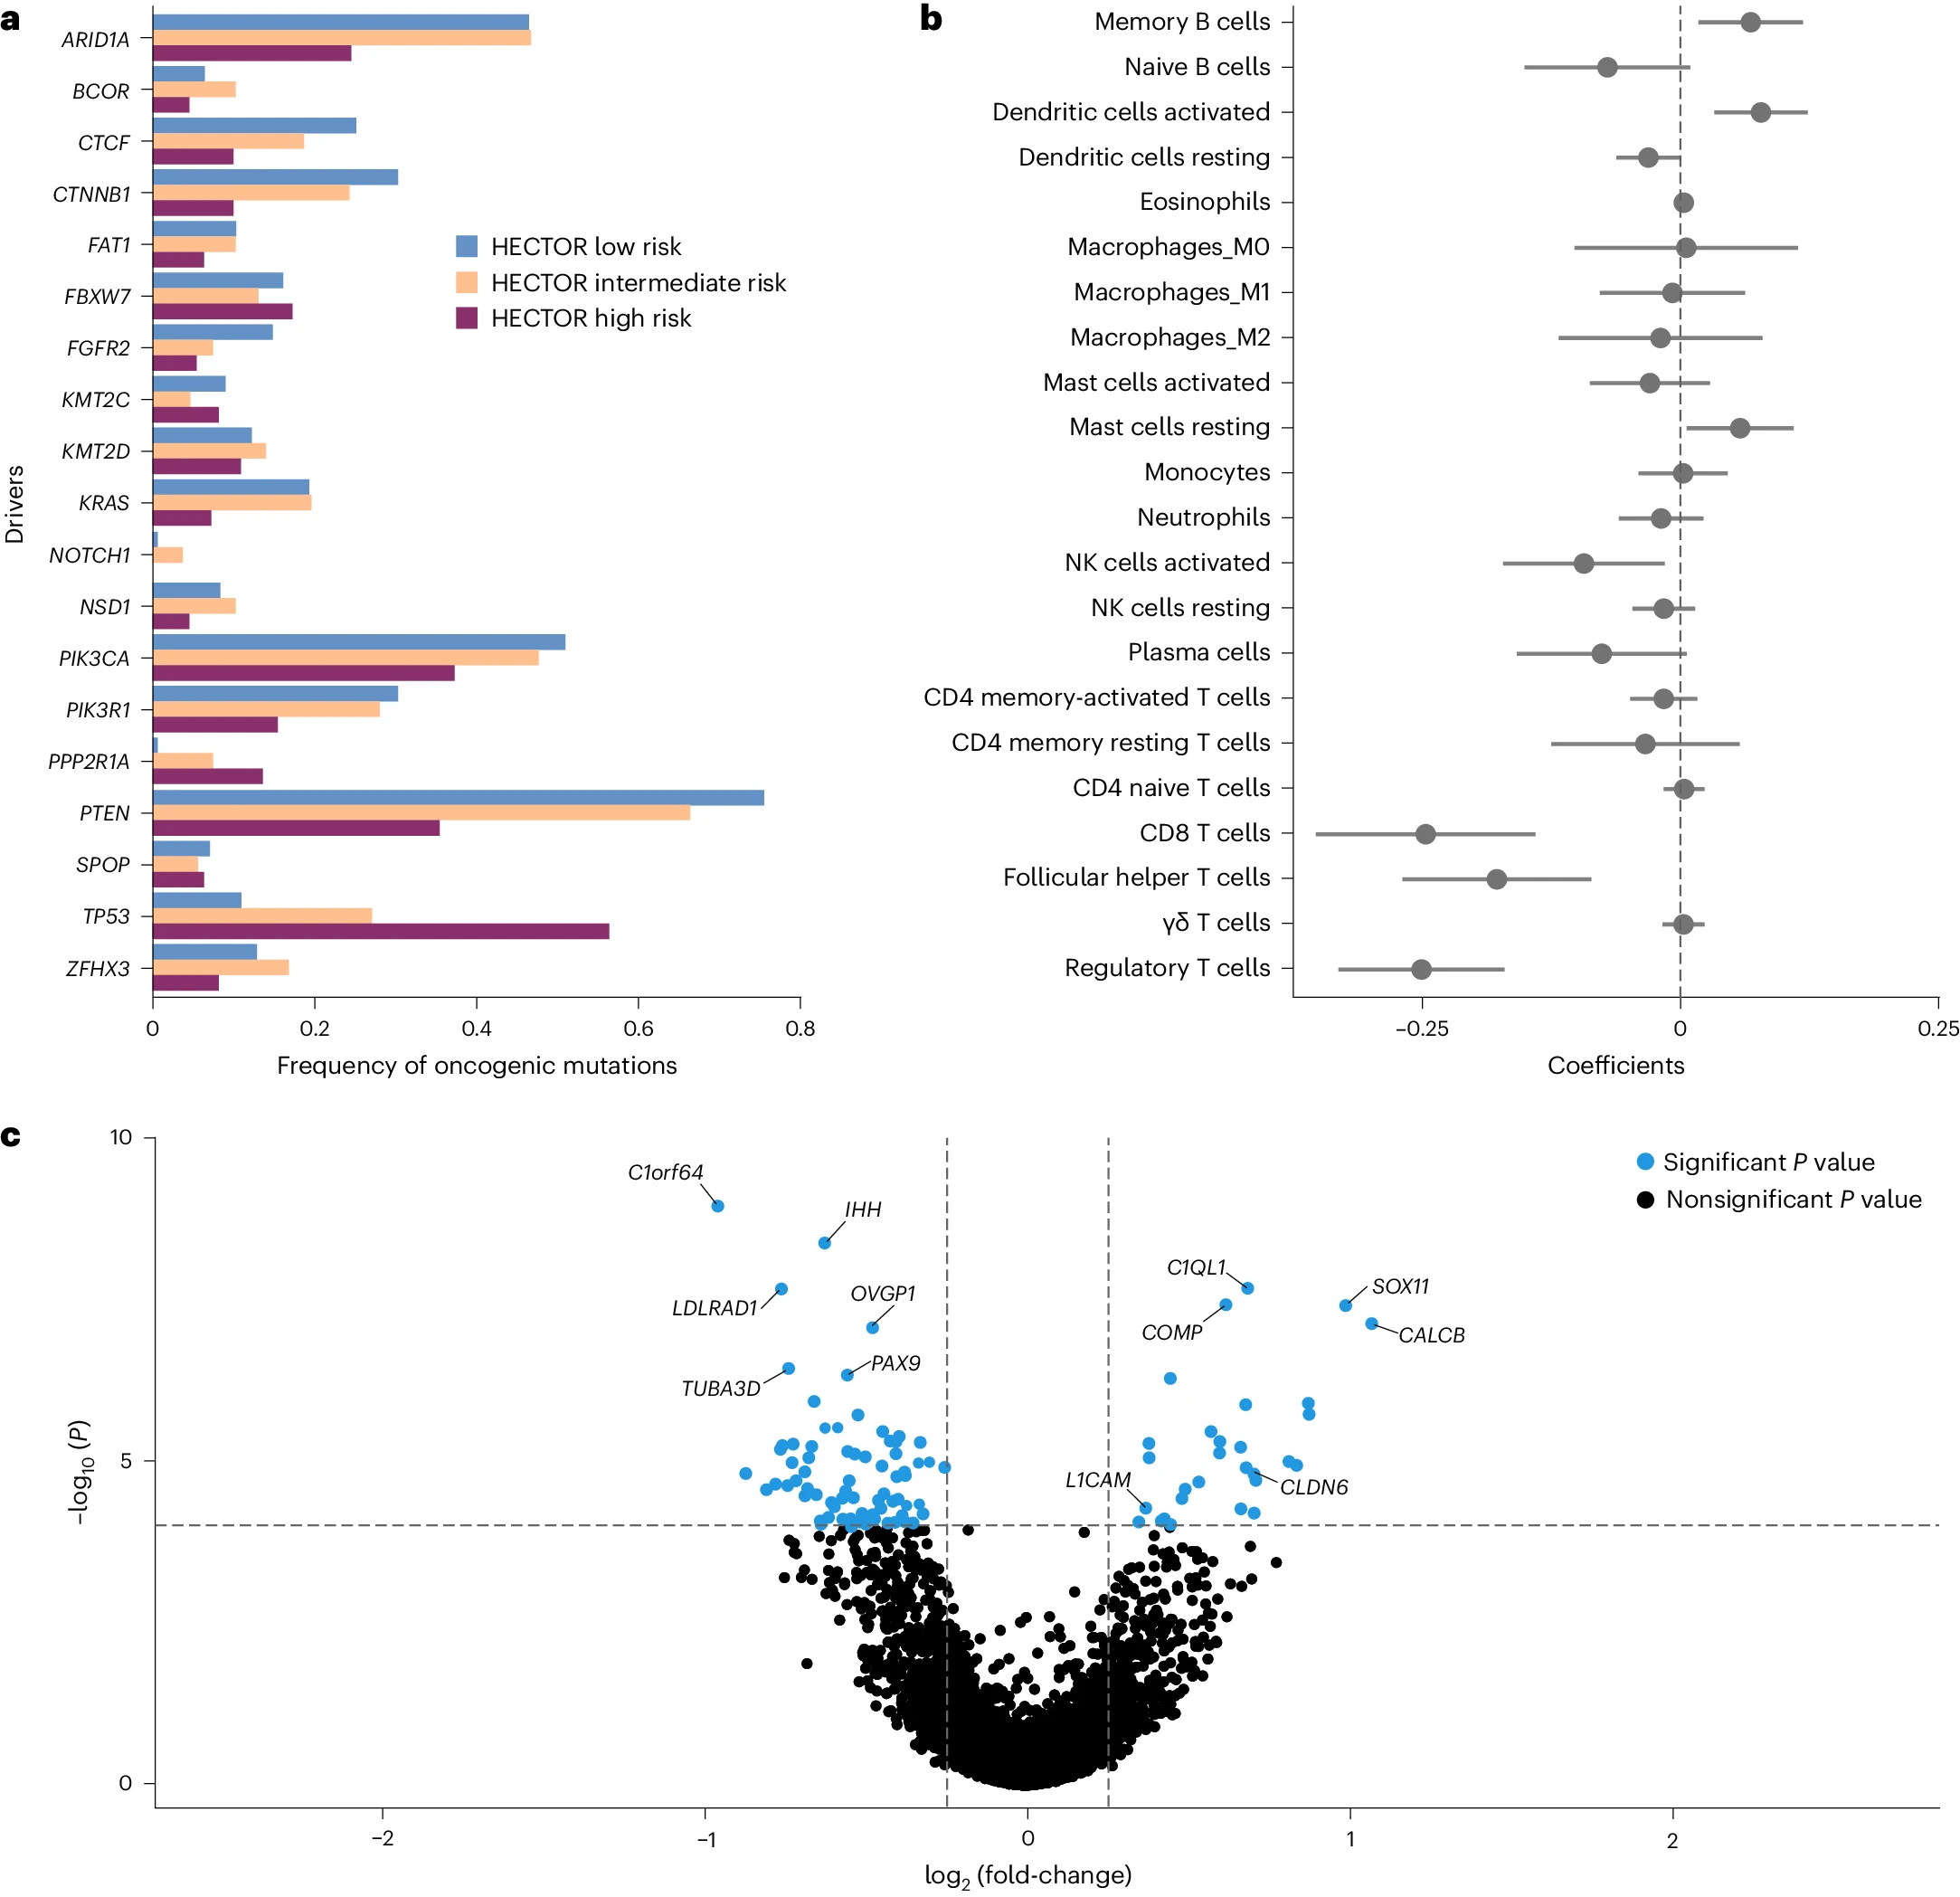
a, Analysis of the mutational frequency of the top 19 genes recognized as key oncogenic alterations in EC for each HECTOR risk group. b, Association of HECTOR risk score with the immune activation gene using multiple single linear regressions (Methods). Data are presented as the coefficients of the linear regression and 95% CIs (n = 381). c, Differential gene expression of HECTOR high-risk versus HECTOR low-risk TCGA-UCEC cases. P values of the likelihood ratio test were adjusted using the Benjamini–Hochberg FDR and statistical significance accepted <0.050.
