
Abstract
Patients with systemic lupus erythematosus (SLE) have been shown to have a high risk of osteonecrosis, but the potential causal relationship between genetic susceptibility and risk of osteonecrosis is unclear. In this study, we used Mendelian randomization to investigate the effects of SLE, gout and rheumatoid arthritis on osteonecrosis, and performed post-GWAS localization and functional analyses of GWAS studies related to osteonecrosis, with the aim of obtaining a more in-depth understanding of the mechanisms of osteonecrosis. In this study, a total of 45 single nucleotide polymorphisms (SNPS) data associated with SLE from publicly available genome-wide association study (GIS) datasets were selected for magnetic resonance estimation using inverse-variance weighting, MR-Eagle method and weighted median method. The Cochrane Q-test, MR-Egger interception, MR-multidirectional residual and outlier methods, entrance/exit analysis and funnel plot were applied for sensitivity analysis. Two-sample Mendelian randomization analysis of the 19 SNPs obtained from screening showed no significant causal effect of SLE and osteonecrosis, and IVW and MR-Egger heterogeneity analyses showed no significant heterogeneity between the instrumental variables (P > 0.05). Multi-phenotype MR analysis showed no significant causal effect between gout and rheumatoid arthritis and osteonecrosis (p > 0.05). The available evidence does not support a significant causal effect of gout and rheumatoid arthritis on osteonecrosis, and the causal effect of SLE on the increased risk of osteonecrosis is only supported by the IVW method, which is of insufficient evidence validity, but suggests a better theoretical basis for the study of heritability related to SLE.
Introduction
Systemic lupus erythematosus (SLE) is a chronic autoimmune disease with systemic damage, characterized by the presence of multiple immune complex deposits and autoantibodies, with complex and varied symptoms affecting multiple organs, from the skin and joints to the kidneys, heart and brain1,2. Epidemiologically, with the establishment of diagnostic criteria for SLE in recent years, researchers have found that SLE predominantly affects young women, and that there is considerable variation in the incidence and prevalence of SLE across regions and ethnicities worldwide3. In Asia, the incidence of SLE ranges from 2.8 to 8.6 per 100,000 and the prevalence ranges from 26.5 to 103 per 100,000, which are different from those in Europe and the U.S4,5. This suggests that the development of SLE may be affected by genetic, environmental, and economic factors, etc.6. The pathogenesis of SLE is very complex, and genetically, it is associated with certain HLA haplotypes7. Genetically, the pathogenesis of SLE is closely related to certain HLA haplotypes, certain complement genes and other genes related to the immune system. Also, DNA hypomethylation and reactivation of the inactivated X chromosome have been identified as two epigenetic hallmarks of SLE8. On the other hand, environmental factors such as ultraviolet radiation, smoking, medications and other factors such as respiratory exposure to crystalline silica dust or air pollution, exposure to chemicals, organic pollutants or heavy metals, vaccinations and infections, exogenous hormones, stress, and diet, alcohol consumption and quality of sleep are also predisposing factors for SLE6,9. The clinical manifestations of SLE are complex, and patients can be seen to have butterfly-shaped erythema, discoidal lesions, arthralgias, osteonecrosis, anemia, peripheral neuropathy, pericarditis, interstitial fibrosis, renal insufficiency and other manifestations10. Among them, osteonecrosis is a high incidence complication of SLE, and it is also the main cause of disability11.
Osteonecrosis (ON) is the result of multiple causes of bone tissue destruction, manifested as osteoarticular pain, bone destruction and loss of function, and is the main cause of disability in SLE, which seriously affects the quality of life of patients12,13. According to relevant studies, the incidence of SLE with ON is the highest among autoimmune diseases14. Some studies have found that systemic inflammation in SLE patients produces oxidized LDL, increased levels of TNF and homocysteine, and that hormone-induced fat embolism, abnormal lipid metabolism, damage to the vascular endothelium, and coagulation dysfunction induces thrombosis in small blood vessels, inhibits osteoclast development, which leads to apoptosis of osteoclasts, and an increase in the maturation and activity of osteoclasts, ultimately resulting in osteonecrosis15,16. A recent study on the correlation between systemic lupus erythematosus and femoral head necrosis pointed out that menstrual abnormalities have been reported for the first time as a risk factor for ONFH in female SLE patients. Patients with SLE onset age ≤ 50 years, maximum daily GC dose ≥ 50 mg, and GC combined with immunosuppressive therapy with menstrual abnormalities have a significantly increased risk of ONFH. This suggests that both genetic and external factors have a certain impact on femoral head necrosis caused by SLE 17. The pathogenesis of osteonecrosis in SLE patients is complex, and the risk factors are still unclear, so it is important to further investigate the characteristics of osteonecrosis complicated by SLE and the risk factors affecting the occurrence of the disease.
Mendelian randomization (MR) is an important method of causal inference in the fields of statistical genetics and genetic epidemiology18. It uses a genetic locus, usually a single nucleotide polymorphism (SNP), as an instrumental variable to infer causal relationships between two phenotypes (exposure and outcome). With the widespread availability of genome-wide association analysis (GWAS), it is becoming increasingly popular to conduct two-sample Mendelian randomization studies using GWAS-reported summary statistics without access to raw genotypic and phenotypic data at the individual level19. In this study we aimed to use Mendelian randomization to study the effects of systemic lupus erythematosus, gout, and rheumatoid arthritis on osteonecrosis, and to perform post-GWAS localization and functional analyses of GWAS studies related to osteonecrosis, with the aim of obtaining a more in-depth understanding of the mechanism of osteonecrosis and providing a reliable theoretical basis for further clinical diagnosis and treatment of osteonecrosis.
Methods and materials
GWAS data acquisition
Retrieved from the GWAS Catalog (https://www.ebi.ac.uk/gwas/downloads/summary-statistics) on systemic lupus erythematosus (SLE) and osteonecrosis (Osteonecrosis), respectively. Genome-wide association analysis (GWAS) summary statistics for SLE (systemic lupus erythematosus) and osteonecrosis (osteonecrosis), respectively. Based on the searches, the complete SLE GWAS dataset (No. GCST90077810) and osteonecrosis GWAS dataset (No. GCST90080565) were selected for download. The SLE GWAS dataset records summary statistics for 458873 SNP loci, and the osteonecrosis GWAS dataset records summary statistics for 510580 SNP loci. Both data were obtained from the literature20 (study number on the GWAS Catalog as GCST90081796), which performed whole-exome sequencing and genome-wide association analysis of 331,754 individuals of European ancestry on the UK BioBank to obtain the summary statistics used in this study. The GWAS summary statistics for the two phenotypes obtained from the download were organized into a standard data frame format, and the name, chromosome number, ___location, reference allele, alternative allele, minimum allele frequency (MAF), and strength of association with the corresponding trait were recorded for each SNP (effect size β = logOR), standard error of estimate (SE) of effect size, and test of significance (P value).
Gout (gout) and Rheumatoid arthritis (Rheumatoid arthritis) GWAS data used for the expanded phenotyping analysis were also obtained from the literature20 and downloaded via the GWAS Catalog (Gout Data No. GCST90080394, Rheumatoid arthritis Data No. GCST90081504).
Screening of instrumental variables
GWAS data of SLE were analyzed using SLE as an exposure factor (exposure). Appropriate SNPs were first selected as instrumental variables based on the Bonferroni-corrected P-value and minimum allele frequency (MAF) of multiple testing (in this study, the constraints of P-value were appropriately relaxed by taking P < 5e − 3 and MAF > 0.01 as the thresholds as the P-value of most of the SNPs was large)21. Then using the genetic linkage coefficients from the linkagereference panel of common SNPs in European populations (1000G phase III EUR) provided by R package TwoSampleMR2 to remove SNPs that were in a high degree of linkage disequilibrium after screening by the P-value of the previous step (set the threshold2 was set to 0.01).
Mendelian randomization analysis
A two-sample Mendelian Randomization (two-sample Mendelian Randomization) model was developed using SLE as the exposure factor (exposure) and osteonecrosis as the outcome variable (outcome). Using R package MendelianRandomization22, the following 11 two-sample estimation methods23,24,25,26 were used respectively:
-
(1)
Inverse variance weighting (IVW): each SNP selected as an instrumental variable can be individually given a dependent estimate by the ratio method \({\widehat{\beta }}_{j}=\frac{{\widehat{\Gamma }}_{j}}{{\widehat{\pi }}_{j}}\) and then integrate them using the inverse variance weighting method in meta-analysis to obtain a combined statistic. i.e.
$${\widehat{\beta }}_{\text{IVW}}=\frac{{\sum }_{j}{w}_{j}{\widehat{\beta }}_{j}}{{\sum }_{j}{w}_{j}}=\frac{{\sum }_{j}{\widehat{\pi }}_{j}{\widehat{\Gamma }}_{j}{\sigma }_{yj}^{2}}{{\sum }_{j}{\widehat{\pi }}_{j}{\sigma }_{yj}^{2}}$$where \({\widehat{\pi }}_{j}\) is the effect size of the jth SNP on exposure X, and \({\widehat{\Gamma }}_{j}\) is the effect size of the jth SNP on ending Y, and \({\sigma }_{yj}^{2}\) is the estimated variance of the effect size of the jth SNP on then outcome Y. The IVW estimate is also equivalent to the \({\widehat{\Gamma }}_{j}\). The estimation of \({\widehat{\pi }}_{j}\) slope coefficients of a weighted regression with an intercept of 0, corresponding to the weightsthat are \(\frac{1}{{\sigma }_{yj}^{2}}\)
-
(2)
Inverse variance weighting with penalty (penalized IVW): based on IVW, the optimization function is \(\sum_{j}{\sigma }_{yj}^{-2}{\left({\widehat{\Gamma }}_{j}-{\beta }_{j}{\widehat{\pi }}_{j}\right)}^{2}\) multiplied by a weighting factor to impose a penalty.
-
(3)
Robust inverse variance weighting (robust IVW): replaces ordinary least squares (OLS) in IVW estimation with robust regression, i.e., uses the MM estimator.
-
(4)
Robust inverse variance weighting with penalty (penalized robust IVW): imposes a penalty on top of robust IVW.
-
(5)
MR-Egger: Consider the case where the chosen IV may have multiple effects. Assume that the path of the instrumental variable through influencing X and thus Y is independent of the path of the instrumental variable through polytropy directly influencing Y (i.e., the InSIDE hypothesis) by modifying the IVW estimator for:\(\widehat{\Gamma }\) For \(\widehat{{\pi }_{j}}\) the slope coefficients of a weighted regression with a non-zero intercept, the corresponding weights, i.e \(\frac{1}{{\sigma }_{yj}^{2}}\). to deal with the effect of multinomiality.
-
(6)
Inverse variance weighted MR-Egger with penalty (penalized MR-Egger): Imposes an L1 regularized penalty term on the polytropic term (i.e., adds lasso regression) on top of MR-Egger. i.e., optimization:
$$\text{argmin}\left[\sum_{j}{\sigma }_{yj}^{-2}{\left({\widehat{\Gamma }}_{j}-{\beta }_{0j}-\beta {\widehat{\pi }}_{j}\right)}^{2}+\lambda \sum_{j}\left|{\beta }_{0j}\right|\right]$$ -
(7)
Robust MR-Egger method (robust MR-Egger): robust regression is used in MR-Egger.
-
(8)
Penalized robust MR-Egger method (Penalized robust MR-Egger): imposes a penalty term in the robust MR-Egger.
-
(9)
Simple median: Assuming that more than half of all IVs are valid IVs, take the median of the ratio estimates obtained for each IV \({\widehat{\beta }}_{j}\). The median of the ratio estimates obtained for each IV is taken.
-
(10)
Weighted median (weighted median): Assuming that the IV with more than half of the weights among all IVs is the valid IV, take the estimated value of the ratio method obtained from each IV and use it as the weighted median of the weighted median.\({\widehat{\beta }}_{j}\) The weighted median of each IV is taken as the weighted median of the ratio method estimates obtained from each IV. \(\frac{1}{{\sigma }_{yj}^{2}}\). The weight is the weighted median of the ratio method estimates obtained for each IV.
-
(11)
Weighted median with penalty (penalized weighted median): adds penalty to the weighted median.
Multiplicity and sensitivity analysis
The following three-part multiplicity and sensitivity analyses were conducted to assess the robustness of the results of Mendelian randomization and to identify the effects of outliers.
-
(1)
Pleiotropy test: Use the mr_pleiotropy_test function of R package TwoSampleMR to conduct the pleiotropy test of SNPs.
-
(2)
Heterogeneity test (Heterogeneity test): reflects the validity of the selected instrumental variables by assessing the variability of the results obtained with the different instrumental variables used. Specifically, using the mr_heterogeneity function of the R package TwoSampleMR, Cochran’s Q statistic was calculated, which was
$$Q={\sum }_{j}{w}_{j}{\left({\widehat{\beta }}_{j}-\widehat{\beta }\right)}^{2}$$where \({\widehat{\beta }}_{j}\) is the coefficient estimate obtained for the jth IV, and \({w}_{j}\) is the corresponding weight, and \(\widehat{\beta }\) is the pooled estimate (pooled estimate) obtained using IVW or MR-Egger merging.
-
(3)
Leave-one-out method: i.e., remove one SNP at a time and use the remaining SNP as IV for MR analysis to check the stability of the results. If the results change a lot after removing a SNP, it means that the existence of a SNP has a great influence on the results, which belongs to the outlier.
Two-way (reciprocal) MR analysis
To determine the direction of causality, bidirectional/reciprocal Mendelian randomization (BDMR) was performed, i.e., after analyzing the causal effect of X on Y using Mendelian randomization, the exposures and endpoints were exchanged, and the original endpoint (i.e., the new exposure) was selected as the appropriate instrumental variable, and a new a Mendelian randomization analysis to obtain an estimate of the causal effect of Y on X.
Multi-phenotype analysis
Based on the above analysis, additional phenotypes were included to test the causal relationship. In this analysis, two phenotypes, gout and rheumatoid arthritis, were included as exposures, and systemic lupus erythematosus and osteonecrosis were included as outcome variables, respectively, in a fourfold Mendelian randomization analysis following a 2–3 step approach.
Post-GWAS analysis of osteonecrosis-associated SNPs
-
(1)
Fine localization of GWAS SNP in osteonecrosis.
Using FUMA (https://fuma.ctglab.nl/) 27, the SNPs associated with osteonecrosis obtained from GWAS were finely localized by combining three methods: positional localization, eQTL localization and chromatin interaction localization. Since the significance of SNPs in the GWAS data of osteonecrosis was weak overall, a loose threshold was set, and all SNPs with P < 0.01 were treated as tag SNPs and entered into the FUMA system for fine localization, and simultaneously carried out position mapping, eQTL mapping and 3D Chromatin Interaction mapping, and the rest of the parameters were kept at default settings.
-
(2)
MAGMA gene set and tissue enrichment analysis Using MAGMA28, the genes obtained from localization were enriched into different gene functional sets and organizations by enrichment analysis (using two classifications, 30 general organizations and 53 organizations from GTEx). By enrichment analysis (Gene Set Enrichment Analysis, GSEA), we mean analyzing whether a set of genes is over-presentation compared to a random level at a certain functional node. Using the exact test of hypergeometric distribution, the p-value for differential expression enrichment analysis, for example, is calculated as
$$p=1-\sum_{j=0}^{x-1}\frac{(\begin{array}{c}M\\ j\end{array})(\begin{array}{c}N-M\\ n-j\end{array})}{(\begin{array}{c}N\\ n\end{array})}$$where N denotes the total number of genes, n denotes the number of differentially expressed genes, M denotes the total number of genes in the gene set, and j denotes the number of differentially expressed genes in the gene set.
-
(3)
Tissue differential expression analysis of genes Using FUMA, differential expression analysis was performed for the genes obtained by fine-mapping, following the 30 general tissue types and 53 tissue types of GTEx v8, mapping the tissue differential expression heatmap of these genes, and enrichment analysis of differentially expressed genes.
-
(4)
Gene function enrichment analysis.
Using more versatile datasets such as GO, KEGG and GWAS Catalog, the above genes were enriched to different biological functional modules and pathways, looking for the functional modules where these genes associated with osteonecrosis are centrally distributed, as well as associations with other diseases and other phenotypes. The specific analysis flowchart is shown in Fig. 1.
Fig. 1 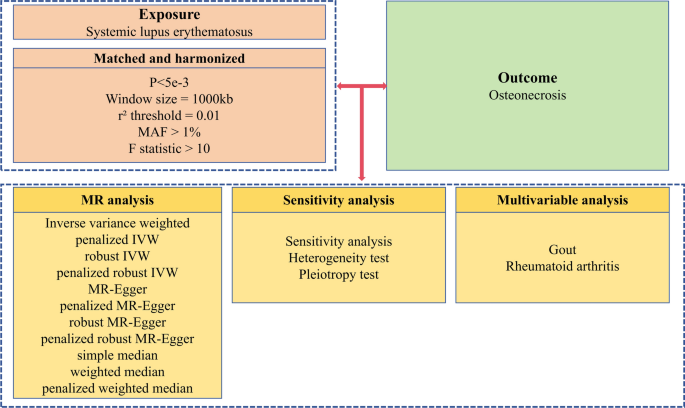
Schematic diagram of research and analysis process.

Results
Screening of instrumental variables
Using SLE as an exposure factor (exposure), GWAS data of SLE were analyzed, and a total of 19 SNPs were obtained as instrumental variables for SLE by screening according to the set criteria (Table 1). The SNP ___location information was referenced using the GRCH38 version of the human reference genome.
Mendelian randomization analysis of systemic lupus erythematosus on osteonecrosis
The results of the MR analysis of the causal effect of SLE (X) on osteonecrosis (Y) using 11 two-sample Mendelian randomization methods for the 19 SNP instrumental variables screened above showed that all 11 methods obtained positive coefficient estimates, but the coefficients were generally large, and only the two methods with stricter assumptions about the instrumental variables, IVW and Penalized IVW obtained P-values less than 0.05. If P < 0.01 is used as a threshold, the results obtained by all methods are not significant. Thus, Mendelian randomization of the two samples suggests that MR analysis is insufficient to support a causal role of SLE on osteonecrosis (Table 2, Fig. 2).

Two sample Mendelian randomization scatter plots of the causal effect of systemic lupus erythematosus on bone necrosis.
Sensitivity analysis
In order to test the robustness of the findings of the above analysis, we carried out a sensitivity analysis as described in the Methods section. Firstly, the test for multicollinearity was conducted. The test results showed P = 0.9628891 > 0.05, indicating that there was no significant pleiotropy. Further heterogeneity tests were conducted for both IVW and MR-Egger methods respectively and the results are shown in Table 3 Using IVW and MR-Egger analysis, there was no significant heterogeneity (P > 0.05) between any of the selected instrumental variables and there was no need to consider heterogeneity in the analysis. This was also corroborated using the FUNNEL PLOT, which showed that the estimates obtained for each SNP were basically symmetrically distributed on the left and right sides of the combined estimates, with no significant bias (Fig. 3A). Finally, a sensitivity analysis using the leave-one-out method was performed showing that the estimates after removing individual SNPs were relatively stable with little change, which is consistent with the results of the previous heterogeneity analysis. On the other hand, it can be seen that although the overall estimate obtained using IVW is significant at the 0.05 confidence level, its estimate after removing a number of IVs also exhibits significant non-significance (Fig. 3B). This echoes the previous analysis that none of the causal estimates obtained from other MR methods (e.g., MR-Egger, median) were significant. Overall, Mendelian randomization analysis tends to support the absence of a significant causal relationship between SLE and osteonecrosis.

Sensitivity analysis. (A) Funnel plot of Mendelian randomization results. The estimated values obtained from each SNP are basically symmetrically distributed on both sides of the merged estimated values. (B) Forest map for sensitivity analysis using the retention method.
Bidirectional MR analysis
To further determine the direction of determining causality, we again performed a two-way Mendelian randomization analysis, the results of which showed that after exchanging exposures and endpoints, the threshold for MAF was relaxed to 0.001, and a total of 32 instrumental variables were obtained from the screening (Supplementary Table 2). Also as can be seen in Table 4 and Fig. 4, most of the MR methods obtained results that osteonecrosis has no significant causal effect on SLE. The estimates obtained using robust MR-Egger and Penalized robust MR-Egger, although significant at the 0.05 confidence level, had positive and negative causal values opposite to most of the estimates. Thus, combining the results of several methods, we think that this study does not provide sufficient evidence for causality between osteonecrosis and SLE.

Scatter plot of complementary MR (bone necrosis in systemic lupus erythematosus).
Multiple phenotype analysis
To further investigate whether there was a causal relationship between other factors and SLE, 19 instrumental variables were obtained by screening for gout as an exposure factor using a P-value threshold of 5e-3 and a MAF threshold of 0.01 and were estimated using 11 Mendelian randomization methods described in Methods using SLE and osteonecrosis as the outcome variables, respectively. The data used for MR of gout on SLE are presented in Supplementary Table 3. As can be seen in Table 5 and Fig. 5A, the various MR methods showed no significant causal effect of gout on SLE. Similarly, as shown in Table 6 and Fig. 5B, various MR methods showed that gout also had no significant causal effect on osteonecrosis. Meanwhile, 26 instrumental variables were obtained by screening for rheumatoid arthritis as an exposure factor using a P-value threshold of 5e-3 and MAF threshold of 0.01, and were estimated using11 Mendelian randomization methods described in Methods using systemic lupus erythematosus and osteonecrosis as the outcome variables, respectively, whose results showed that the weighted median and the penalized weighted median methods showed a significant protective causal effect of rheumatoid arthritis against SLE, whereas none of the causal estimates obtained by the other methods were significant. Further analyzing this difference, the heterogeneity test for instrumental variables found that the p-values of heterogeneity for IVW and MR-Egger were 5.555270e − 23 and 2.371897e − 23, respectively, which means that there was significant heterogeneity among the instrumental variables (Table 7 and Fig. 5C); at this point, the median estimator is informative, and it can be assumed that the results of the MR analyses to a certain extent support a somewhat protective effect of rheumatoid arthritis against SLE, but more evidence from other analyses (triangulation) is needed to support this. Similarly, as shown in Table 8 and Fig. 5D, the various MR methods showed that rheumatoid arthritis had no significant causal effect on osteonecrosis.

Multi phenotype analysis. (A) Mendelian randomization scatter plot of gout on systemic lupus erythematosus. (B) Mendelian randomization scatter plot of gout on bone necrosis. (C) Mendelian randomization scatter plot of rheumatoid arthritis on systemic lupus erythematosus. (D) Mendelian randomization scatter plot of rheumatoid arthritis on bone necrosis.
Post-GWAS analysis of osteonecrosis-related SNPs
Further FUMA fine-tuning and functional analysis of the obtained osteonecrosis GWAS summary statistics revealed that FUMA fine-tuned to a total of 292 protein-coding genes. Gene set enrichment analysis using MAGMA revealed that these localized genes were enriched to the most significant set of 10 genes (Table 9) (Fig. 6A). Continued use of MAGMA further enriched genes into different tissues based on the degree of active expression, as shown in Fig. 6B,C. It can be seen that some of the genes associated with osteonecrosis are actively expressed in tissues associated with the digestive system (salivary glands, stomach, etc.) and some brain tissues. To further determine the tissue differential expression of these osteonecrosis-associated genes, we drew heat maps of the expression of these genes in different tissues (Supplementary Figs. 1, 2) and performed the enrichment test of tissue differentially expressed genes (Fig. 6D,E). It can be seen that the differential expression of these 292 genes was enriched in uterine tissues. Finally, we performed functional enrichment analysis of these 292 localized genes. The results showed that these genes were enriched on the transcription factor targets NRNP70_TARGET_GENES, E2F_Q6 and E2F_Q4 (Fig. 7A) and were associated with a number of other disorders, including dental caries, carotid plaque, and schizophrenia (Fig. 7B).

Post GWAS analysis of bone necrosis related SNPs. (A) GWAS Manhattan map of osteonecrosis. FUMA has finely mapped a total of 292 protein coding genes. (B) Expression analysis of 30 general tissues in MAGMA. (C) Expression analysis of 53 MAGMA tissues. (D) Enrichment testing of differentially expressed genes in 30 general tissues of GTEx v8. (E) Enrichment testing of differentially expressed genes in 53 tissues of GTEx v8.

Functional enrichment analysis of key genes. (A) Enrichment of osteonecrosis related genes at transcription factor targets. Mainly enriched in NRNP70_TARGET_Genes, E2F_Q6 and E2F_Q4 transcription factor targets. (B) Enrichment of osteonecrosis related genes in other GWAS Catalog phenotypes.
Discussion
This study used MR to assess the causal relationship between SLE, gout, rheumatoid arthritis, and osteonecrosis, and is the first study to assess the causal relationship between SLE, gout, rheumatoid arthritis, and osteonecrosis from the perspective of genetic variation using a two-sample bidirectional MR method. Mendelian randomization is a genetic epidemiological research method that uses single nucleotide polymorphism sites (SNPs) as instrumental variables to infer whether there is a causal relationship between two phenotypes (exposure and outcome)29. In our study, MRanalyses showed that the available evidence did not support a significant causal effect of gout and rheumatoid arthritis on osteonecrosis, and the causal effect of SLE on the increased risk of osteonecrosis was supported only by the IVW methodology, which is not sufficiently evidence valid, and needs to be corroborated by other methods of epidemiological studies. However, the results of fine localization and functional analyses indicate that osteonecrosis-related genes are enriched in some transcription factor targets and are potentially associated with some other traits (e.g., dental caries, carotid plaque, schizophrenia, etc.).
Rheumatoid arthritis is a systemic autoimmune disease characterized by small joint lesions, which are symmetrical, chronic, and ultimately cause joint deformation30. Rheumatoid arthritis is a disease with a high disability rate, ranking first among hospitalized patients in rheumatology31. In recent years, studies have shown that patients with rheumatoid arthritis often rely on hormone therapy. Long term and excessive use of hormones may lead to lipid metabolism disorders, increase pressure inside the femoral head, affect blood supply, and ultimately cause femoral head necrosis. In our study, through Mendelian joint analysis, we did not find a significant genetic relationship between rheumatoid arthritis and osteonecrosis32. However, we can see that the weighted median and pended weighted median methods show that rheumatoid arthritis has a significant protective causal effect on systemic lupus erythematosus. Therefore, we speculate that rheumatoid arthritis may have a causal relationship with osteonecrosis to some extent, but more rigorous and effective methods may be needed for exploration.
In recent years, there has been a steady flow of studies on the relationship between the occurrence of osteonecrosis and SLE33,34. During the development of SLE, complications such as infection, atherosclerosis, osteoporosis, and osteonecrosis often occur, of which osteonecrosis is the main cause of disability in SLE35. Ioana Ruiz-Arruza et al.35,36. observed that osteonecrosis occurred in 4 out of 230 patients with SLE (1.74%), and in the 72 patients with SLE treated with glucocorticoid hormone in the follow-up of Oinuma et al.37. The incidence of osteonecrosis within 5 months could be up to 44%, which seriously affects the quality of survival of patients. Some studies have reported that the incidence of ON in SLE patients is the highest among the diseases treated with hormones. Meanwhile, according to related studies, cumulative hormone dose is an important predictor of osteoporotic fracture, ischemic necrosis and muscular dystrophy, etc., and there is a significant negative correlation between the use of glucocorticoids and bone mineral density. For every 10 mg/d increase in hormones, the incidence of osteonecrosis increased by 3.6%38,39. The positive correlation between hormone dose and the incidence of osteonecrosis in patients with systemic lupus erythematosus (SLE) fully confirms that hormone therapy may be a major risk factor for osteonecrosis in patients with SLE.
Systemic lupus erythematosus (SLE) is a common specific autoimmune disease occurring systemically or organically, and usually results in disease when the balance between pathogen recognition and avoidance of self-attack is disrupted40. Immune complexes formed by autoantibodies and autoantigens are deposited in the vessel wall, causing an inflammatory response through activation of complement, leading to the accumulation of inflammatory cells in the vessel wall, resulting in vascular and tissue damage, and then disorders of the coagulation and fibrinolytic systems, which can lead to thrombosis and even vascular occlusion, and ultimately to bone41,42. Therefore, some studies have confirmed that vasculitis may also be one of the important causes of osteonecrosis complicated by SLE43. According to many literature data, the hidden factors of osteonecrosis complicated by SLE are extremely complex, such as vasculitis, Raynaud’s phenomenon, thrombophlebitis, antiphospholipid, antibodies, plasma membrane inflammation, renal disease, arthritis, etc.44,45, which can cause osteonecrosis due to inflammation, narrowing of vascular internal diameter and increase of extravascular pressure, and it is still difficult to determine the specific pathogenic mechanism of SLE.
While traditional observational studies may be biased by potential confounders and reverse causality, MR studies can mimic randomized controlled trials in an observational setting and effectively avoid the confounding bias of randomly assigned SNPs at conception46. In our study, we investigated the possible causal relationship between SLE and osteonecrosis by using Mendelian randomization analysis. On the one hand, we screened the GWSR database with a large sample size, strictly followed the three core assumptions of MR, strictly screened the instrumental variables to avoid the weak instrumental bias and excluded the confounding SNPs by using the PhennoScannerV2 to ensure the rationality and validity of the whole analysis process. PhennoScannerV2 was used to exclude SNPs associated with confounders to ensure the rationality and validity of the whole analysis process. On the other hand, this study also conducted several sensitivity analyses to strengthen the robustness of the results.
According to the current report, the incidence rate of osteonecrosis caused by SLE is increasing year by year, and the specific causes and pathogenesis are also complex and diverse, which has not been completely clear yet47,48. Some studies have shown that the use of glucocorticoid is a positive factor in SLE leading to osteonecrosis, and the incidence rate of osteonecrosis is as high as 44%44,49. However, some studies also shown that not all SLE patients treated with glucocorticoids will experience osteonecrosis50. Some SLE patients with concurrent osteonecrosis have never received treatment with glucocorticoids, so their autoimmune factors and genetic susceptibility are also important factors in the occurrence of osteonecrosis in SLE patients.
The results of this study explain the relationship between systemic lupus erythematosus and osteonecrosis from a genetic perspective, providing new directions for clinical diagnosis and treatment of osteonecrosis caused by systemic lupus erythematosus. As is well known, SLE as a hereditary autoimmune disease, has a complex pathogenesis, and there is currently no good treatment for accumulated organ dysfunction. This study uses Mendelian genetic analysis to reveal the genetic relationship between the occurrence of osteonecrosis and SLE from the perspective of epigenetic genetics, providing a theoretical basis and research direction for exploring the specific pathogenic mechanism of later osteonecrosis.
Of course, there are some limitations in this study. Firstly, the data sets used in this study are mainly from Europe, and there is no corresponding data set for Asian populations, so the applicability of the results to Asian populations needs to be further explored. Secondly, although we have revealed that there is no obvious causal relationship between SLE and osteonecrosis from the genetic point of view, the specific mechanism is very complicated and needs to be further verified by experimental studies in the future.
In summary, this study explored the possible causal association between SLE and osteonecrosis from a genetic perspective and preliminarily determined that there is no significant causal relationship between SLE and osteonecrosis, providing new insights for subsequent genetic studies of SLE.
Data availability
The datasets used or analyzed during the current study are available from the corresponding author upon reasonable request.
References
Zucchi, D. et al. Systemic lupus erythematosus: One year in review 2023. Clin. Exp. Rheumatol. 41(5), 997–1008 (2023).
Siegel, C. H. & Sammaritano, L. R. Systemic lupus erythematosus: A review. JAMA 331(17), 1480–1491 (2024).
Gergianaki, I., Bortoluzzi, A. & Bertsias, G. Update on the epidemiology, risk factors, and disease outcomes of systemic lupus erythematosus. Best Pract. Res. Clin. Rheumatol. 32(2), 188–205 (2018).
Tanaka, Y. et al. Systemic lupus erythematosus: Targeted literature review of the epidemiology, current treatment, and disease burden in the Asia Pacific Region. Arthritis Care Res. (Hoboken) 74(2), 187–198 (2022).
Barber, M. R. W. et al. Global epidemiology of systemic lupus erythematosus. Nat. Rev. Rheumatol. 17(9), 515–532 (2021).
Gulati, G. & Brunner, H. I. Environmental triggers in systemic lupus erythematosus. Semin Arthritis Rheum 47(5), 710–717 (2018).
Rasouli-Saravani, A. et al. Relevance of autoantibody profile with HLA-DRB1 and -DQB1 alleles in a group of Iranian systemic lupus erythematosus patients. Immunol. Lett. 237, 11–16 (2021).
Weeding, E. & Sawalha, A. H. Deoxyribonucleic acid methylation in systemic lupus erythematosus: Implications for future clinical practice. Front. Immunol. 9, 875 (2018).
Northcott, M. et al. Immunosuppressant exposure confounds gene expression analysis in systemic lupus erythematosus. Front. Immunol. 13, 964263 (2022).
Tsokos, G. C. Autoimmunity and organ damage in systemic lupus erythematosus. Nat. Immunol. 21(6), 605–614 (2020).
Kaneko, K. et al. Glucocorticoid-induced osteonecrosis in systemic lupus erythematosus patients. Clin. Transl. Med. 11(10), e526 (2021).
Mendoza-Alonzo, J., Zayas-Castro, J. & Soto-Sandoval, K. Osteonecrosis in individuals with systemic lupus erythematosus: A predictive model. Reumatol. Clin. (Engl. Ed.) 16(2 Pt 2), 161–164 (2020).
Hernigou, P., Hernigou, J. & Scarlat, M. Shoulder osteonecrosis: Pathogenesis, causes, clinical evaluation, imaging, and classification. Orthop. Surg. 12(5), 1340–1349 (2020).
Yin, X. et al. Biological insights into systemic lupus erythematosus through an immune cell-specific transcriptome-wide association study. Ann. Rheum. Dis. 81(9), 1273–1280 (2022).
Torrente-Segarra, V. & Bonet, M. Multifocal osteonecrosis in systemic lupus erythematosus: Two case reports and literature review. Eur. J. Rheumatol. 8(1), 46–47 (2021).
Hussein, S. et al. Monitoring of osteonecrosis in systemic lupus erythematosus: A systematic review and metaanalysis. J. Rheumatol. 45(10), 1462–1476 (2018).
Xu, W. et al. Risk factors and prediction model for osteonecrosis of the femoral head in female systemic lupus erythematosus. Front. Immunol. 15, 1381035 (2024).
Bowden, J. & Holmes, M. V. Meta-analysis and Mendelian randomization: A review. Res. Synth. Methods 10(4), 486–496 (2019).
Wang, J. et al. Genome-wide association studies (GWAS) and post-GWAS analyses of impulsivity: A systematic review. Prog. Neuropsychopharmacol. Biol. Psychiatry 132, 110986 (2024).
Backman, J. D. et al. Exome sequencing and analysis of 454,787 UK Biobank participants. Nature 599(7886), 628–634 (2021).
Swerdlow, D. I. et al. Selecting instruments for Mendelian randomization in the wake of genome-wide association studies. Int. J. Epidemiol. 45(5), 1600–1616 (2016).
Yavorska, O. O. & Burgess, S. MendelianRandomization: An R package for performing Mendelian randomization analyses using summarized data. Int. J. Epidemiol. 46(6), 1734–1739 (2017).
Burgess, S., Butterworth, A. & Thompson, S. G. Mendelian randomization analysis with multiple genetic variants using summarized data. Genet. Epidemiol. 37(7), 658–665 (2013).
Bowden, J., Davey Smith, G. & Burgess, S. Mendelian randomization with invalid instruments: Effect estimation and bias detection through Egger regression. Int. J. Epidemiol. 44(2), 512–525 (2015).
Bowden, J. et al. Consistent estimation in mendelian randomization with some invalid instruments using a weighted median estimator. Genet. Epidemiol. 40(4), 304–314 (2016).
Rees, J. M. B. et al. Robust methods in Mendelian randomization via penalization of heterogeneous causal estimates. PLoS ONE 14(9), e0222362 (2019).
Watanabe, K. et al. Functional mapping and annotation of genetic associations with FUMA. Nat. Commun. 8(1), 1826 (2017).
de Leeuw, C. A. et al. MAGMA: Generalized gene-set analysis of GWAS data. PLoS Comput. Biol. 11(4), e1004219 (2015).
Noordam, R. Mendelian randomization-let’s prevent common mistakes. J. Gerontol. A Biol. Sci. Med. Sci. 79(11) (2024).
Brown, P., Pratt, A. G. & Hyrich, K. L. Therapeutic advances in rheumatoid arthritis. BMJ 384, e070856 (2024).
O’Neil, L. J., Alpízar-Rodríguez, D. & Deane, K. D. Rheumatoid arthritis: The continuum of disease and strategies for prediction, early intervention, and prevention. J. Rheumatol. 51(4), 337–349 (2024).
Seki, K. et al. Medication-related osteonecrosis of the jaw in a patient with rheumatoid arthritis with suspected involvement of methotrexate and tocilizumab. J. Dent. Sci. 19(4), 2428–2429 (2024).
Gladman, D. D. et al. Osteonecrosis in SLE: Prevalence, patterns, outcomes and predictors. Lupus 27(1), 76–81 (2018).
Wei, Q. et al. Relationship between osteonecrosis and antiphospholipid antibodies in patients with systemic lupus erythematosus: A systematic review protocol. BMJ Open 11(7), e046163 (2021).
Ersin, M. et al. Symptomatic osteonecrosis of the hip and knee in patients with systemic lupus erythematosus: Prevalence, pattern, and comparison of natural course. Lupus 30(10), 1603–1608 (2021).
Ruiz-Arruza, I. et al. Glucocorticoids and irreversible damage in patients with systemic lupus erythematosus. Rheumatology (Oxford) 53(8), 1470–1476 (2014).
Oinuma, K. et al. Osteonecrosis in patients with systemic lupus erythematosus develops very early after starting high dose corticosteroid treatment. Ann. Rheum. Dis. 60(12), 1145–1148 (2001).
Zhao, L. et al. Symptomatic knee osteonecrosis in patients with systemic lupus erythematosus: A case-control study. Rheumatol. Int. 36(8), 1105–1111 (2016).
Zhang, K. et al. Systemic lupus erythematosus patients with high disease activity are associated with accelerated incidence of osteonecrosis: A systematic review and meta-analysis. Clin. Rheumatol. 37(1), 5–11 (2018).
Desai, R. et al. SLE and multiple myeloma: An underlooked link? A review of case reports from the last decade. J. Med. Life 17(2), 141–146 (2024).
Pan, L. et al. Immunological pathogenesis and treatment of systemic lupus erythematosus. World J. Pediatr. 16(1), 19–30 (2020).
Bentham, J. et al. Genetic association analyses implicate aberrant regulation of innate and adaptive immunity genes in the pathogenesis of systemic lupus erythematosus. Nat. Genet. 47(12), 1457–1464 (2015).
Kuthyar, S. et al. Systemic lupus erythematosus-associated retinal vasculitis treated with adalimumab. Ocul. Immunol. Inflamm. 30(4), 981–985 (2022).
Qijiao, W. et al. Antiphospholipid antibodies and osteonecrosis in systemic lupus erythematosus: A meta-analysis. Expert Rev. Clin. Immunol. 17(8), 923–932 (2021).
Kallas, R., Li, J. & Petri, M. Predictors of osteonecrosis in systemic lupus erythematosus: A prospective cohort study. Arthritis Care Res. (Hoboken) 74(7), 1122–1132 (2022).
Köhler, C. A. et al. Mapping risk factors for depression across the lifespan: An umbrella review of evidence from meta-analyses and Mendelian randomization studies. J. Psychiatr. Res. 103, 189–207 (2018).
Abeles, M. et al. Osteonecrosis in SLE. Rheumatol. Int. 32(3), 833 (2012).
Webber, D. et al. Genetics of osteonecrosis in children and adults with systemic lupus erythematosus. Rheumatology (Oxford) 62(9), 3205–3212 (2023).
Ruiz-Irastorza, G., Danza, A. & Khamashta, M. Glucocorticoid use and abuse in SLE. Rheumatology (Oxford) 51(7), 1145–1153 (2012).
Salesi, M. et al. A case of SLE with bilateral osteonecrosis of femoral heads and bone infarct in distal of femur. Rheumatol. Int. 30(4), 527–529 (2010).
Acknowledgements
We thank the authors who contributed to the article but did not appear in the article.
Funding
This work was supported by Yunnan Provincial Clinical Orthopaedic Trauma Medical Center (Second Cycle); Yunnan Orthopedics and Sports Rehabilitation Clinical Medicine Research Center (No. 202102AA310068).
Author information
Authors and Affiliations
Contributions
B.C.Q.,J.L.Z.,designed the study; J.L.Z.,C.M., L.Q.P.,and C.L., provided code and analytical advice; P.F.B.,C.M.,Y.Q.X., and W.Q.Z., provided analytical advice and critical interpretation of findings; B.C.Q.,Y.Q.X.,C.L.,and J.L.Z., conducted all analyses and drafted the manuscript; all authors edited and approved the manuscript.
Corresponding authors
Ethics declarations
Competing interests
The authors declare no competing interests.
Animal ethics
This study does not involve animal or human trials.
Additional information
Publisher’s note
Springer Nature remains neutral with regard to jurisdictional claims in published maps and institutional affiliations.
Rights and permissions
Open Access This article is licensed under a Creative Commons Attribution-NonCommercial-NoDerivatives 4.0 International License, which permits any non-commercial use, sharing, distribution and reproduction in any medium or format, as long as you give appropriate credit to the original author(s) and the source, provide a link to the Creative Commons licence, and indicate if you modified the licensed material. You do not have permission under this licence to share adapted material derived from this article or parts of it. The images or other third party material in this article are included in the article’s Creative Commons licence, unless indicated otherwise in a credit line to the material. If material is not included in the article’s Creative Commons licence and your intended use is not permitted by statutory regulation or exceeds the permitted use, you will need to obtain permission directly from the copyright holder. To view a copy of this licence, visit http://creativecommons.org/licenses/by-nc-nd/4.0/.
About this article

Cite this article
Qi, B., Zhao, J., Meng, C. et al. Exploring the association between systemic lupus erythematosus and osteonecrosis by Mendelian randomization analysis. Sci Rep 15, 15040 (2025). https://doi.org/10.1038/s41598-025-95467-z
Received:
Accepted:
Published:
DOI: https://doi.org/10.1038/s41598-025-95467-z
