
Abstract
Lithium-sulfur (Li-S) batteries are considered promising candidates for next-generation energy storage due to their high theoretical energy density and the abundance of sulfur. However, challenges such as poor compatibility with carbonate-based electrolytes and the need for excessive electrolyte volumes limit their practical implementation. Here, we explore biocarbon derived from olive pomace, an agricultural by-product, as a sulfur host for Li-S batteries operating in carbonate-based electrolytes. We use two KOH activation methods—liquid and solid—to tailor the porosity and surface properties of the biocarbon. The solid-activated biocarbon exhibits higher surface area, micropore volume, and sp2 carbon content, promoting efficient sulfur confinement and enabling solid-state sulfur conversion. We find that electrochemical performance remains stable regardless of sulfur loading or electrolyte volume. The resulting sulfur cathodes showed excellent electrochemical performance with a discharge capacity of 850 mAh gS−1 with a sulfur loading of 4 mgS cm−2 and an electrolyte-to-sulfur ratio of 5 µL mgS−1. Remarkably, these electrodes also perform well at high current densities, delivering a capacity of 620 mAh gS−1 at 1 C and 360 mAh gS−1 at 5 C.

Introduction
The global energy landscape is undergoing a significant transformation as the demand for sustainable and renewable energy sources increases1,2,3. However, renewable energy sources are inherently intermittent, creating challenges in maintaining a consistent and reliable energy supply4. To address these challenges, new energy storage systems are essential. Advanced energy storage technologies can store excess energy generated during periods of high production and release it during periods of low production or high demand. Lithium-sulfur (Li-S) batteries and other emerging storage technologies offer the potential to provide higher energy densities, longer cycle life, and greater efficiency compared to conventional Li-ion batteries1,4,5,6.
Li-S cells are one of the most attractive batteries for next-generation energy storage. Sulfur is non-toxic, abundant, and low-cost, and possesses a theoretical specific capacity of 1672 mAh g−1. Coupled with metallic lithium, high gravimetric energy densities can be achieved, as lithium has a high specific capacity of 3860 mAh g−1 6,7. However, Li-S batteries face significant challenges, primarily related to the interaction between sulfur and the electrolytes. Carbonate-based electrolytes interact with the discharge products of sulfur (polysulfides) through a nucleophilic substitution reaction, making the use of these electrolytes nearly impossible8. Consequently, research over the last decade has mainly focused on ether-based electrolytes9,10,11,12. However, in these electrolytes, lithium polysulfides can easily dissolve, causing the commonly known shuttle effect, which leads to capacity fading and shortened cycle life. An alternative solution is to use microporous carbons (pore width <2 nm) as host materials for sulfur, enabling the use of carbonate-based electrolytes13. This combination facilitates the in-situ formation of a cathode-electrolyte interphase (CEI) during the first discharge, which enables the solid-state conversion of sulfur to Li2S in the ultramicropores. This solid-state mechanism allows for long-term cyclability6,11,12,14,15. Hence, the electrolyte plays a crucial role in Li-S batteries, affecting their overall performance, efficiency, and stability16. Optimizing the electrolyte quantity is also essential to achieve a balance between ionic conductivity and electrochemical performance. It has been stipulated that, in order for Li-S batteries to compete with current Li-ion batteries, the sulfur-electrolyte ratio should be less than 5 µL mgS−117,18. This requirement is usually difficult to achieve because of the use of high surface area carbons in the sulfur cathode, which makes them difficult to wet. Moreover, to compete with state-of-the-art Li-ion batteries, the sulfur cathode should have a loading greater than 5 mgS cm−217,18.
Various types of microporous carbons, such as commercial carbons15 and biocarbon6, have been utilized for Li-S batteries in carbonate-based electrolytes. Among these, biocarbon, derived from the pyrolysis of biomass, can be produced from renewable sources and even from organic waste materials. The properties of biocarbon are influenced by both the synthesis method and the type of biomass precursor. Additionally, biocarbon can exhibit tunable porosity and surface functional groups, making it suitable for various applications such as water filtration19, soil amendment20, and energy storage systems7,21,22. One way to tune the porosity of biocarbon materials is to use KOH as a chemical activating agent. During the activation process, KOH interacts with the carbonaceous material, enhancing the development of a porous structure. The reaction between KOH and carbon triggers the formation of gases that facilitate the development of pores, particularly small mesopores and micropores. During this activation process, carbon is oxidized, resulting in the formation of water, carbon dioxide, hydrogen, potassium carbonate, and metallic potassium7,23.
A promising source of biocarbon is olive pomace, a lignocellulosic by-product of olive oil extraction, which poses environmental risks due to its acidic pH, high organic content, and non-biodegradable phenolic substances24. Rich in cellulose, hemicellulose, lignin, and phenolic residues, olive pomace undergoes significant chemical transformations during pyrolysis25. At temperatures up to 500 °C, pyrolysis breaks down these components, releasing volatile compounds such as acetic acid, furfural, and phenols, while producing bio-oil and a carbon-rich residue known as char. This char, primarily composed of aromatic carbon structures, can be further enhanced through KOH activation at temperatures up to 900 °C. This activation process etches the carbon structure, creating numerous micropores that significantly increase the surface area and pore volume of the resulting biocarbon23.
In this work, biocarbon was synthesized from olive pomace, a residue from olive oil extraction, using two different KOH activation methods. The resulting biocarbon features a microporous network with pore widths of ~1 and 2 nm. This porous structure was successfully infiltrated with sulfur and tested as cathodes for Li-S batteries. A detailed electrochemical characterization using carbonate-based electrolytes revealed long-term cycling with nearly 100% capacity retention over 300 cycles, and achieving 620 mAh gS−1 at 1 C and 360 mAh gS−1 at 5 C. Notably, this performance remained unchanged regardless of sulfur loading or electrolyte volume.
Results and discussion
Physicochemical characterization
The synthesized biocarbon exhibits a purely microporous structure, as confirmed by N2 adsorption/desorption isotherms (Fig. 1A). The activated samples exhibit Type I isotherms26. This type of isotherm is characterized by a significant increase in adsorbed volume at low-pressure regions (p/p0 < 0.05), indicating the presence of micropores. The isotherms show no increase in adsorbed volume at high relative pressures and lack a significant hysteresis loop, suggesting that the biocarbon possesses a purely microporous structure. In contrast, the non-activated (A59) sample shows no nitrogen adsorption throughout the experiment, indicating that this material is either non-porous or that the pores are closed. This demonstrates that the open porous structure of the biocarbon (A5AL9 and A5AS9) results from the activation treatments. The calculated BET surface areas were 1520 and 1600 m2 g−1 for the A5AL9 and A5AS9, respectively. Table S1 summarizes the contributions of the micro- and mesopore components to the surface area and pore volume. It should be noted that almost all of the samples’ surface area is attributed to micropores. The pore size distribution, calculated using the DFT method with slit/cylindrical pores, is shown in Fig. 1B. The calculation reveals the presence of pores of ~1.1 and 2.5 nm in size for both samples. For the infiltrated samples, the N2 adsorption isotherms are flat, indicating that most of the pores were filled with sulfur during infiltration (Fig. 1A).

A N2 physisorption isotherms of biocarbon (and infiltrated samples) at 77 K, along with corresponding. B differential cumulative QSDFT pore size distribution.
The SEM images (Fig. S1) and EDX maps (Fig. S2) provide initial insights into the shape, texture, and chemical composition of the particle samples. SEM imaging shows that the particles have irregular shapes with rough textures and uneven, sharp edges, indicating that the material may have broken apart or formed clusters. The EDX elemental maps reveal an uneven distribution of carbon (C), oxygen (O), and sulfur (S). Sulfur appears to be well distributed across the carbon framework in both samples.
To gain a deeper understanding of the internal structure and nanoscale morphology of the biocarbon, TEM imaging was performed. As shown in Fig. S3A, B, both samples (A5AL9 and A5AS9) consist of heterogeneous particles with no well-defined micro-geometry, ranging in size from 0.2 µm to 1.8 µm. The images (Fig. 2A–C) also reveal that the biocarbon material is composed of disordered graphitic layers with an interlayer distance of approximately 0.33, 0.38, and 0.35 nm for the A59, A5AL9, and A5AS9 materials, respectively. The biocarbon samples exhibit a disordered, isotropic structure characterized by tightly curled carbon layers enclosing interconnected pores with a slit/cylindrical shape. These pores have a width of ~1.5 nm, consistent with the analysis from the N2 adsorption isotherms. XRD measurements were also performed to further investigate the structure of the biocarbon (Fig. S4 and Note 1 in the ESI). The three synthesized carbons exhibit two broad peaks at 2θ of 24° and 45°, corresponding to the (002) and combined (100) and (101) crystal planes of a carbon structure, respectively27. The A59 sample displayed several diffraction signatures of different inorganic materials present in olive pomace. These signatures disappeared due to dissolution during the activation treatments with KOH. The interlayer distance between carbon layers (d-spacing) was calculated from the (002) reflection using Bragg’s equation28. The (002) peak is slightly shifted to a higher angle for the solid activated sample, indicating a decrease in the interlayer spacing of the A5AS9 sample and a higher degree of graphitization. The calculated d-spacings from the XRD are (0.395 ± 0.002) nm for A5AL9 and (0.365 ± 0.002) nm for A5AS9, respectively. These values support the observation from TEM and are slightly larger than that of highly crystalline graphite (0.335 nm).
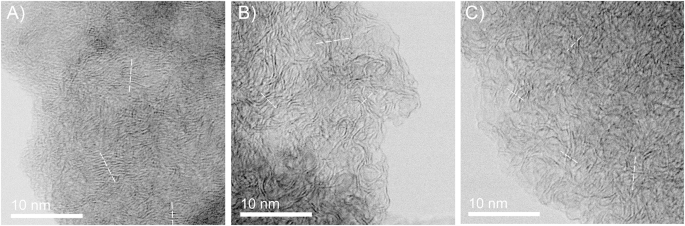
High-resolution TEM images of A A59, B A5AL9, and C A5AS9 samples.
X-ray photoelectron spectroscopy (XPS) was used to study the surface properties of the biocarbons. XPS analysis included extended survey spectra to determine the quantitative composition (Table S2), the S 2p region (Fig. S5), and a detailed examination of the C 1 s spectra (Fig. 3). Additionally, the D-parameter was also employed, derived from the first derivative of the C KVV Auger peak, to accurately assess the C-sp2 content. Elemental composition analysis revealed that, in addition to C and O (and S in the infiltrated samples A5AL9-S and A5AS9-S), the non-activated sample (A59) contains trace elements such as Si, Cl, P, Ca, and a significant amount of K. These elements likely originate from the raw material and persist despite thermal treatments and washing procedures. Samples subjected to liquid activation exhibit a substantial increase in carbon surface content (~85 at.%) and a reduction in oxygen content by approximately one-third (~11.5 at.%). The concentrations of other elements found in the A59 sample decrease sharply or, in the case of K, disappear entirely. A similar trend is observed in samples prepared with solid activation, where elements such as K, Cl, P, and Ca are absent. However, N atoms are detected in these solid-activated samples, potentially due to superficial adsorption of N2 molecules during treatment, which may be displaced following sulfur infiltration (A5AS9-S). As shown in Table S2, the A59 sample has the highest O/C ratio, which decreases drastically in the activated samples. Furthermore, the relative amount of infiltrated sulfur is higher in the solid-activated sample compared to the liquid-activated one (S/CA5AS9-S = 0.14 vs. S/CA5AL9-S = 0.09).

C 1 s XPS spectrum for the synthesized biocarbon A A59, B A5AL9, and C A5AS9; along with the sulfur infiltrated materials D A5AL9-S, and E A5AS9-S.
To identify the chemical environment of the samples, the C 1 s (Fig. 3) and S 2p (Fig. S5) spectra were carefully examined. In the non-activated sample (A59, Fig. 3A), a significant presence of oxidized carbon species and an overlap with the K 2p doublet is observed. In contrast, the C 1 s regions of the activated samples are closely comparable, featuring a predominant peak at 284.4 ± 0.1 eV, attributed to sp2 carbon atoms in highly delocalized C–C bonds. Between 284.8 eV and ~289 eV, sp3 carbon atoms are detected, either singly bound to carbon and hydrogen (such as in edge or defective graphitic carbons at 284.8 eV) or bonded to oxygen, along with expected features from π-π* excitation energy losses. Detailed data from the deconvoluted peaks are provided in Table S3, along with the percentage content of each species. The table shows a significant increase in graphitic carbon content after activation (liquid or solid), increasing from ~51% to ~70–80%. It also reveals a decrease in oxygenated carbon species following sulfur infiltration. The S 2p spectra of the A5AL9-S and A5AS9-S samples (Fig. S5) exhibit a dominant doublet at 164.0 eV, corresponding to S8 species from the sulfur infiltration process.
Deconvoluting sp2 spectra from the C 1 s regions can introduce uncertainties, largely due to the fitting parameters used for asymmetry and full width at half maximum (FWHM). Selecting appropriate baseline parameters is a complex process that must also consider the particle size of the sample being analyzed. For example, parameters suitable for highly ordered pyrolytic graphite are not applicable to porous carbonaceous samples because of the significant differences in hydrogenated carbon content, which results in an increase in FWHM (from 0.5 to 0.7 eV in our case). While XPS is primarily a surface-sensitive technique, typically probing only the top few nanometers of a material, its application in quantifying sp²/sp³ carbon ratios in bulk materials may seem counterintuitive. However, alternative analytical approaches within XPS, such as the use of the D-parameter, can help mitigate this limitation. The D-parameter, derived from the first derivative of the C KVV Auger peak, is particularly useful in distinguishing between sp² (graphitic) and sp³ (diamond-like) hybridizations due to their distinct Auger spectral shapes. Lascovich et al. 29 demonstrated that the D-parameter could effectively differentiate sp2 and sp3 carbon states by analyzing the first derivative of the carbon Auger peak. The separation (D-parameter) of the differential maxima and minima varies significantly depending on the relative concentrations of sp2 and sp3 carbon30. Fig. 4A shows the first derivative of the C KVV C-Auger peaks for the activated samples, while Fig. 4B presents the D-parameter values plotted against the calculated pure sp2 content (%), with reference values included for clarity. This method effectively distinguishes sp2 content, as the trends observed in the deconvoluted C 1 s spectra (Fig. 3) align with the D-parameter, consistently indicating approximately 10% lower sp2 content for the liquid activated biocarbon. Therefore, the solid activation with KOH results in an increased amount of sp2-hybridized carbon.

A First differential of the C KVV Auger peak for A5AL9, A5AL9-S, A5AS9, and A5AS9-S, the vertical dotted lines show the minimum and the maximum of the first derivative. B Plot of XPS-derived D-parameter versus the calculated amount of C-sp2 for activated and reference samples.
Thermogravimetric analysis (TGA) in an Ar atmosphere (Fig. S6) shows that elemental sulfur evaporates completely at 350 °C. For the infiltrated samples, there is a loss of 30 wt.% and 40–45 wt.% at ~300–500 °C for the A5AL9-S and A5AS9-S, respectively. The higher temperature needed for the removal of sulfur is due to the allocation of sulfur in the micropores of the host carbon material, which requires more energy to be completely desorbed31. The solid activated material can accommodate more sulfur due to its higher micropore volume of 0.61 cm3 g−1 (Table S1). Meanwhile, the sample without activation (A59-S) exhibits a weight loss (~15 wt.%) at lower temperatures (~200–300 °C), indicating the presence of sulfur, but we speculate that the sulfur is only on the surface. Hence, we successfully infiltrated up to 45 wt.% of sulfur into the micropores of the synthesized activated biocarbon, with no appreciable amount of sulfur outside the pores. The sulfur contents determined by TGA (~30 wt.% for A5AL9-S and ~40–45 wt.% for A5AS9-S) are consistent with those measured by CHNS elemental analysis (31.2 wt.% for A5AL9-S and 46.3 wt.% for A5AS9-S) in Table S4, confirming effective sulfur infiltration into the micropores. It should be noted that, based on the pore volume, the A5AS9 sample can accommodate up to 54 wt.% of sulfur, while the A5AL9 sample can hold up to 45 wt.%. Considering this and the fact that the TGA isotherms for the infiltrated samples are flat (Fig. 1A), we can conclude that most of the pores in the solid-activated samples were fully saturated with sulfur. In contrast, for the liquid-activated samples, part of the pore structure appears to have been blocked, preventing full sulfur infiltration.
These findings suggest that the activation method plays a critical role in determining the material’s suitability for sulfur hosting. The XPS analysis, in particular, reveals that the increased sp² carbon content and enhanced graphitization in the solid-activated biocarbon contribute significantly to improved electronic conductivity. Next, a detailed electrochemical analysis is carried out using the A5AL9-S and A5AS9-S samples as active cathode material in Li-S batteries with carbonate-based electrolyte.
Electrochemistry
The electrochemical properties of Li-S cells using synthesized microporous biocarbons as host materials for sulfur were studied by galvanostatic discharge/charge tests at C/10. First, cells with a low sulfur loading of 1 mgS cm⁻2 and a high electrolyte to sulfur ratio (20 µl mgS⁻1) were examined. This ensures that the limiting electrochemical process originates from the S/C material. The discharge/charge profiles of the two C/S composites are shown in Fig. 5A, B. Both display the same electrochemical features. In the first discharge, there is a short initial plateau at 2.2 V vs. Li/Li+ (less than 120 mAh gS⁻1), possibly due to the reduction of residual sulfur outside the pores to Li2S8 and/or the interaction of the electrolyte with the carbon free surface area15,32. The first discharge continues with a long plateau at 1.7 V vs. Li/Li+ for both cells. According to literature15, two processes occur simultaneously in this region: a) the reduction of sulfur in the micropores to Li2S2/Li2S, and b) the formation of the CEI33,34,35. In other to observe the contribution of bare biocarbon in the CEI formation, tests without sulfur were performed and can be found in Note 2 and Fig. S7 in SI. The occurrence of these two processes together explains why the cells deliver higher capacities than the theoretical capacity of sulfur (1672 mAh gS−1). As a result, the capacity during the first reduction process for the first cycle is 2160 and 1940 mAh gS−1 for the A5AL9-S and A5AS9-S, respectively. From the second discharge onward, only one plateau is distinguished at 1.8 V vs. Li/Li+, consistent with the solid-state conversion of sulfur to lithium disulfide/sulfide6. The charge profile consistently shows a single plateau at 2.1 V vs. Li/Li+, representing the oxidation of Li2S/Li2S2 to S8. Upon cycling, a small increase in the overpotential of the charge plateau is observed, which may be related to the passivation of the lithium metal anode surface after many discharge/charge cycles, likely due to the formation of dead lithium on the surface36.

Charge/discharge profiles for Li-S cells using A A5AL9-S and B A5AS9-S cathodes; C cycling stability at 0.1 C; and D rate capability.
The cycle stability is shown in Fig. 5C. Both materials exhibit notable electrochemical stability. After the initial five stabilization cycles, both cells delivered a specific capacity of 870 mAh gS−1. The cell with A5AL9-S exhibits a capacity fading of only 50 mAh gS−1 after 200 cycles, representing a capacity retention of 94%. However, at cycle 240, the capacity began to fade, possibly due to the depletion of FEC and passivation of the lithium anode21,36. Consequently, at this point, the lithium metal anode was replaced, and fresh electrolyte was added, resulting in the cell stabilizing again at 750 mAh gS−1 for more than 100 cycles. The stabilization after the anode replacement indicates that the capacity fading was due to issues with the lithium anode rather than the cathode material. Furthermore, Fig. S8A–C presents the lithium anode after cycling in the A5AL9-S cell. It is evident that a significant portion of the electrode is covered in inactive (‘dead’) lithium, and the SEI layer appears highly uneven. These observations strongly indicate that lithium loss and SEI instability are key contributors to the observed capacity degradation.
For the A5AS9-S material, the cell maintained its initial capacity over 300 cycles. Both cells exhibited a Coulombic efficiency (CE) of 99.99%, consistent with solid-state conversion behavior in Li-S batteries. The remarkable cycling stability observed here underscores the potential of olive pomace-derived biocarbon as a cost-effective and sustainable solution for next-generation energy storage systems. In addition, the materials were compared with ether-based electrolytes to illustrate the exceptional performance of olive pomace-derived biocarbon in carbonate-based electrolytes (see Note 3 and Fig. S9 in SI).
C-rate tests were performed by varying the current density during both the discharging and charging of the cells. As shown in Fig. 5D, both A5AL9-S and A5AS9-S materials exhibited similar behavior, delivering average capacities of 1000, 880, 710, 620, and 510 mAh gS−1 at C/20, C/10, C/2, C, and 2 C, respectively. The difference becomes noticeable at 5 C, where the cell with A5AS9-S delivered a capacity of 285 mAh gS−1, while the cell with A5AL9-S achieved 360 mAh gS−1. Additionally, the cathodes regained their original capacities when the current density was reduced back to C/10, indicating that the materials do not exhibit a memory effect. This demonstrates the robustness and stability of the materials under varying operational conditions. The discharge/charge profiles for the different rates are shown in Fig. S10, where no other plateaus besides those previously described can be observed. As the current density increases, an increment in overpotential is observed for both charge and discharge processes, likely due to mass transport limitations and/or the fast kinetics of the electrochemical reactions involved (charge transfer). For further analysis, the potential difference (ΔE) was defined as the difference between the voltage of the charge plateau and the discharge plateau (considering the potential at half the total capacity). The ΔE for both cathodes as a function of current density is shown in Fig. S11. From C/2 onwards, the A5AS9-S cell exhibits a greater ΔE than the A5AL9-S cell. This difference can be attributed to the higher carbon-to-sulfur ratio in the A5AS9-S cathode, where the S/C atomic ratio is 0.14 compared to 0.09 for the A5AL9-S (Table S2). These results suggest that the increase in ΔE is likely due to charge transfer limitations. These properties will be analyzed in more detail below.
Li+ diffusion was studied by varying the sweep rates (υ) of the cyclic voltammetry (CV). The CV curves are displayed in Fig. 6A, B, where only one oxidation and one reduction peak can be distinguished. As the sweep rate increases, the reduction peak shifts to a lower potential and the oxidation peak shifts to a higher potential, in accordance with the trend observed in the C-rate analysis. According to the Randles-Sevcik equation (see Note 4 of SI), the peak current (Ip) has a linear dependency on the square root of the sweep rate (Fig. 6C), allowing the estimation of the diffusion coefficient for lithium ions (DLi+). The DLi+ values calculated were 1.8 × 10⁻⁹ cm2 s⁻1 and 3.7 × 10⁻⁹ cm2 s−1 for the A5AL9-S and A5AS9-S cathodes, respectively. The reported order of magnitude for this parameter varies from 10−9 to 10−12 cm2 s−1 for solid-state conversion Li-S batteries37.

Cyclic voltammetry measurements at different scan rates (υ) of A A5AS9-S and B A5AL9-S Li-S cells; C CV peak current versus the square root of the scan rate and their linear fitting; and overpotential from GITT measurements at different states of D discharge and E charge.
Galvanostatic intermittent titration technique (GITT) measurements were also performed to determine the diffusion coefficient of the Li-S batteries (Fig. S12). We performed a formation cycle at C/20, after which GITT measurements were performed. Experimental details are given in the support information section (see Note 5 of SI). Unlike CVs, GITT allows calculation of how diffusivity changes with the state of discharge/charge (SoD(C)) of the cell38,39. In Fig. S13, the diffusion coefficient as a function of SoD(C) is presented. The values are in agreement (order of magnitude) with those measured using CVs. From the analysis of both experiments, it was observed that the diffusion is slower when the Li-S batteries are being delithiated. This analysis of the diffusion mechanism aligns with the findings of Para et al. 15, who demonstrated that the charging rate is significantly more limiting than the discharging rate.
The overall overpotential of the cell (considering charge transfer, mass transfer, adsorption, etc.) can also be investigated using GITT (see Note 6 of SI). Two different behaviors can be observed during the lithiation and delithiation of the cell for both A5AL9-S and A5AS9-S (Fig. 6D, E). At the beginning of the discharge (2% SoD), the overpotential is 0.18 V. As the cell becomes more lithiated, the overpotential decreases, reaching a minimum of 0.11 V and 0.09 V for the A5AL9-S and A5AS9-S cells, respectively. This minimum occurs at the same potential as the discharge plateau and lasts from 10% SoD to 70% SoD. This is reasonable because, during the plateau, the system is in a steady state of thermodynamic equilibrium, and therefore, the overpotential becomes minimal. At the end of the discharge (SoD > 70%), the overpotential increases again. The mechanism can be explained as follows: initially, a higher overpotential is required to initiate the reaction. Once it starts, it operates in a quasi-equilibrium state. As the cell becomes more lithiated, the overpotential increases again, indicating that lithiation becomes increasingly difficult at higher SoD. The lower overpotential required for the A5AS9-S cell can be attributed to the properties of the biocarbon. As explained in the physicochemical characterization section, the XPS and XRD results indicate that the solid activation treatment increased the sp² carbon content and the degree of graphitization. The higher sp² content directly enhances electronic conductivity and may also improve Li⁺ transport by creating more ordered graphite layers and a more uniform electron distribution. These improved conductivities facilitate more efficient electrochemical processes within the cathode. Although the delithiation process is kinetically more favorable than lithiation at early SoC, extreme overpotentials, as high as 0.5 V, are required to fully delithiate the material at high SoC (>80%). This indicates that the charging process becomes increasingly unfavorable, necessitating strategies to improve its efficiency at later stages. The variation in the overpotential can also be explained in terms of diffusivity: if diffusion is slower during delithiation, as mentioned before, a greater overpotential is needed to counteract this effect.
Electrolyte and high sulfur loading tests
To investigate the effect of the electrolyte on the A5AS9-S cathode, galvanostatic discharge/charge experiments were performed under the same conditions as those studied above, but varying the electrolyte amount (5, 10, and 20 µL mgS−1). For these experiments, the sulfur loading was increased to 2 mgS cm⁻2. The results are shown in Fig. 7A, B. Remarkably, the discharge/charge profiles are indistinguishable across the three different ratios tested; the plateau length and voltage remain the same (1000 mAh gS−1 and 1.8 V vs Li/Li+). Furthermore, the cells exhibit the same cycling stability (Fig. 7B) as the tests conducted with electrolyte excess and low sulfur loading (1 mgS cm−2). The fact that such a low amount of electrolyte can be used without changes in capacity or overpotential is attributed to the carbon structure. As was explained in the physicochemical characterization section, carbon contains micropores, and these pores account for the entire surface area. After sulfur infiltration into the micropores, the surface area of these powders drastically diminishes (Table S1), thus enabling the use of a lower amount of electrolyte. The results confirm that the electrolyte amount does not affect the capacity of the cathode materials and suggest that sulfur loading also does not affect the cycling stability at C/10 rate for at least 30 cycles.

A Charge/discharge profiles and B cycling stability for A5AS9-S-Li cell with different amounts of electrolyte.
As varying the electrolyte amount had no noticeable effect on the cathode, the sulfur loading was increased to 4 mgS cm⁻2 while using 5 µL mgS−1 of electrolyte (Fig. S14). Once again, the A5AS9-S cathode material demonstrated reversible capacities of 850 mAh gS−1 for almost 80 cycles, maintaining the same discharge/charge profiles. Complementary results and discussion can be found in the supplementary information section (see Note 7 of SI and Fig.S15). The main difficulty encountered at this stage was the formation of dendrites on the lithium anode every few cycles (Figs. S14 and S15), due to the high stress on the Li surface. The current needed for cycling at 1 C for this loading is 5.2 mA cm⁻2 and at 5 C is 25 mA cm⁻2. We want to emphasize that the sulfur loading was increased fourfold, which means that the lithium needed for the electrochemical reaction is eight times higher, while at the same time reducing the amount of FEC by four times, yet achieving the same specific capacities. Moreover, the N/P ratios for these experiments were calculated (see note 8 of SI), where the N/P ratio for the 4 mgS cm−2 cathodes is slightly larger than one. It is well established that dendrite formation leads to lithium consumption and loss of active lithium, which compromises long-term cycling stability. This is precisely why FEC is commonly used—as a key additive to stabilize the lithium metal surface. In this case, when the N/P ratio approaches unity, the role of FEC becomes even more critical. This analysis reinforces our previous conclusions, highlighting the importance of electrolyte composition—particularly fluorinated solvents like FEC—in maintaining cell stability and enabling high-performance Li–S batteries under lean electrolyte and high-loading conditions. In this regard, further research should focus on electrolyte optimization and lithium metal anode protection to achieve long-term cycling with high sulfur loading cathodes.
Conclusions
In this work, we successfully synthesized biocarbon from olive oil residue using two different KOH activation methods: liquid and solid activation. These biocarbon materials were employed in Li-S batteries as host materials for sulfur. The synthesized materials, both with and without sulfur, were thoroughly characterized in terms of morphology, structure, and atomic composition. N2 adsorption/desorption isotherm measurements confirmed the presence of micropores in the biocarbon materials obtained by the KOH activation, with solid activation proving to be more efficient by generating a higher micropore volume. This, in turn, allowed for a higher sulfur ratio. XPS, TEM, and XRD analyses further revealed that solid activation enhanced the level of graphitization and increased the sp² carbon content.
Electrochemical analysis of the sulfur cathodes demonstrated exceptional stability, with both cathodes maintaining their initial capacities for ~300 cycles with Coulombic efficiencies of 99.99%. The cathodes also delivered reversible capacities of 360 mAh g⁻1 at a high current density of 5 C. We demonstrated that the capacities delivered at C/10 were independent of sulfur loading in the cathode and the amount of electrolyte, achieving capacities of 850 mAh g−1 for cathodes with a loading of 4 mgS cm⁻2 and electrolyte quantity of 5 µl mgS−1.
However, we observed challenges in the lithiation and delithiation processes. The lithiation process required higher overpotentials as the cell became more lithiated, indicating increasing difficulty in the gradient of lithiation. Conversely, the delithiation process, while kinetically more favorable at early stages, required extreme overpotentials to fully delithiate the material at high states of charge (SoC > 80%). Additionally, dendrite formation on the lithium anode was observed, particularly under high sulfur loading conditions. Addressing these challenges through improved electrolyte formulations and anode protection strategies will be crucial for further enhancing the practicality of these systems.
Methods
Synthesis of biocarbon and sulfur infiltration
Olive pomace was collected from Olium (https://www.olium.com.ar), a company specializing in olive oil production, located in Córdoba, Argentina. First, the residue was directly pyrolyzed in an alumina tube furnace at 500 °C for 30 min with a heating ramp of 5 °C min⁻1 in N2 atmosphere. The sample obtained by the pyrolysis was denoted as A5. After this, three sets of samples were prepared.
Liquid activation process
A5 was mixed with KOH (Sigma-Aldrich) in a 1:1 weight ratio under magnetic stirring in distilled water. Once the solvent was evaporated, the activated A5 was carbonized at 900 °C for 1 h in N2 atmosphere. The resultant carbon was then washed with 7 wt.% HCl (Sigma-Aldrich) and milli-Q water until neutral pH was reached. This sample is labeled A5AL9.
Solid activation process
A5 and KOH were mixed in a 1:1 weight ratio and directly carbonized at 900 °C for 1 h in N2 atmosphere. The same washing procedure as for the A5AL9 was carried out. This sample was labeled A5AS9.
Non-activated sample
A5 was carbonized at 900 °C for 1 h in N2 atmosphere without any activation process. This sample was denoted as A59.
Before sulfur infiltration, the samples were milled using a Fritsch Planetary Micro Mill (Pulverisette 7), with 10 mm diameter stainless steel balls to reduce the particle’s size. The protocol consisted of milling the carbons for 1 h at 600 rpm, with a 10 min rest every 15 min. The ball-to-carbon volume ratio was kept at 1:1. Then, the powders were mixed with elemental sulfur (Sigma-Aldrich) in a 1:2 weight ratio and ball milled at 300 rpm for 30 min. Each mixture was then placed in a borosilicate glass vial for thermal treatment, which was carried out in a Büchi Glass Oven. The mixtures were heated to 100 °C under a dynamic vacuum for 3 h to fully unblock the pores of the carbonaceous structure. Then, they were heated to 155 °C under a static vacuum for 5 h, and finally heated to 300 °C for 30 min to remove all sulfur not infiltrated into the micropores. This last step is intended to completely avoid undesired reactions between polysulfides formed outside the carbon structure with the electrolyte, thus ensuring the integrity of the electrolyte in the cells 40. The resultant C/S composites were labeled as A5AL9-S, A5AS9-S, and A59-S, and were used as the active material for Li-S batteries with carbonate-based electrolytes. All chemicals are battery grade and are from Sigma-Aldrich.
Materials characterization
The synthesized activated biocarbon and sulfur-activated biocarbon composites were characterized using different techniques. The textural parameters were obtained from nitrogen gas adsorption isotherms using a NOVA 1000e porosimeter at 77 K (Quantachrome, Boynton Beach, FL, USA). The total pore volume and surface area, along with meso and micropore characteristics, were determined using Gurvich’s rule, Brunauer-Emmett-Teller (BET), and the α-plot method with an NPC standard isotherm, respectively. Pore size distribution was calculated using the DFT method, specifically applying the QSDFT adsorption branch kernel for slit/cylindrical pores. The morphology and particle size distribution of the samples were examined with a scanning electron microscope (SEM) equipped with EDX from Zeiss Oberkochen, Germany; and with a transmission electron microscope (TEM) from JEOL, Tokyo, Japan. The cycled Li metal electrodes were used in a field-emission scanning electron microscope (FE-SEM) Apreo 2 S (Thermo Fisher Scientific, Netherlands), equipped with a Clean Connect vacuum transfer system (Thermo Fisher Scientific, Netherlands) and an energy dispersive spectrometer Ultim Max 100 (Oxford, UK). TEM samples were prepared by dispersing 0.1 mg of each powder in 4 ml of ethanol in an ultrasonic bath for 1 h, then placing 20 μl of the suspension on a copper TEM grid. The XPS analysis was conducted using a Thermo Scientific K-Alpha+ X-ray Photoelectron Spectrometer. Measurements were performed at room temperature under a high vacuum pressure of 10⁻9 mbar. For excitation, non-monochromatized Al-Kα radiation (1200 W) was employed, with a 180° double-focusing hemispherical analyzer and a sampling area diameter of 200 µm. Each sample was mounted in duplicate: one on copper tape (to prevent interference from carbon signals commonly associated with carbon tape) and the other on a specialized powder plate. Due to the conductive nature of the samples, a charge neutralization system was unnecessary. Survey spectra, along with core-level spectra for carbon (C 1 s), oxygen (O 1 s), sulfur (S 2p), and the X-ray-induced C KVV Auger spectra, were collected for detailed analysis. The pass energy and energy resolution were set to 100 eV and 0.5 eV, respectively, for survey scans, and to 20 eV and 0.05 eV for the C 1 s, O 1 s, and S 2p core levels. Spectral deconvolution was performed using Voigt functions, utilizing Avantage and Igor software. The asymmetric parameters for the C 1 s peak from sp2 C-C were derived from commercial C-superP conductive powder. In order to investigate the crystal structure of the samples, a PANalytical X’Pert PRO high-resolution diffractometer was used with Cu Kα₁ radiation (λ = 1.5406 Å). Sulfur content was determined by TGA was performed on an STA 449 F3 Jupiter using an argon atmosphere and a heating rate of 10 °C min⁻1 until reaching a maximum temperature of 900 °C. For an elemental analysis, a Perkin-Elmer EA 2400 Series II CHNS/O, coupled with an automatic ultra-microbalance AD-6 Autobalance, was used. For oxidation, pure oxygen (>99.999%) was used. The combustion temperature was >1800 °C, for the gases separation, frontal chromatography was used and thermal conductivity for the quantification.
Electrochemical characterization
Cathodes were prepared using the as-prepared sulfur-activated biocarbon composites, PVdF as a binder, and C65 as a conductive agent in an 8:1:1 weight ratio, with N-methyl-2-pyrrolidone as the solvent. The slurries were mixed in a planetary ball mill at 300 rpm for 30 min. After that, the slurry was immediately spread over carbon-coated aluminum foil and dried at 80 °C overnight. Electrodes were punched into circular disks of 2 cm2 and dried for 48 h at 50 °C to remove all traces of water. Pouch-type two-electrode cells were assembled in an argon-filled glovebox (MBraun, O2, and H2O < 0.1 ppm) using the sulfur cathodes, lithium metal (0.35 mm thickness) as the counter and reference electrode, and a Celgard 2320 separator. The electrolyte used was 1 M LiPF6 in dimethyl carbonate: fluoroethylene carbonate (FEC) = 4:1 v/v15,33,41, with the amount set according to the sulfur content in the cathode. The sulfur loading in the cathodes varied from 1 to 4 mgS cm⁻2, and the electrolyte volume from 5 to 20 μl mgS⁻1. All chemicals are battery grade and are from Sigma-Aldrich, except FEC and LiPF6, which are from Alfa-Aesar.
For long-term galvanostatic discharge/charge experiments, cells were cycled at C/20 (C = 1.672 A g⁻¹) for the first 5 cycles for stabilization, then at C/10 between 1 and 3 V vs. Li/Li+. Coulombic efficiencies were calculated as the ratio between the discharge capacity of cycle n + 1 and the charge capacity of cycle n, where n is greater than 1. C-rate experiments were also performed in the same voltage window, varying the current density from C/20 to 5 C. CyV was recorded at scan rates from 0.1 to 2.5 mV s⁻¹. The GITT was performed with the following steps: a current (C/30) was applied for 15 min, followed by a relaxation time of 4 h. All tests were conducted at room temperature. The GITT and CV experiments were performed using a Biologic VMP3, while galvanostatic discharge/charge was done with a Maccor 4200 potentiostat/galvanostat (Maccor, Inc.).
Data availability
The data that support the findings of this study are available from the corresponding authors upon reasonable request.
References
Kebede, A. A., Kalogiannis, T., Van Mierlo, J. & Berecibar, M. A comprehensive review of stationary energy storage devices for large scale renewable energy sources grid integration. Renew. Sustain. Energy Rev. 159, 112213 (2022).
Kober, T., Schiffer, H. W., Densing, M. & Panos, E. Global energy perspectives to 2060 – WEC’s world energy scenarios 2019. Energy Strateg. Rev. 31, 100523 (2020).
Blondeel, M., Bradshaw, M. J., Bridge, G. & Kuzemko, C. The geopolitics of energy system transformation: a review. Geogr. Compass 15, e12580 (2021).
Trahey, L. et al. Energy storage emerging: a perspective from the Joint Center for Energy Storage research. Proc. Natl. Acad. Sci. USA 117, 12550–12557 (2020).
Robinson, J. B. et al. 2021 roadmap on lithium sulfur batteries. J. Phys. Energy 3, 31501 (2021).
Helen, M. et al. Single step transformation of sulphur to Li2S2/Li2S in Li-S batteries. Sci. Rep. 5, 12146 (2015).
Bracamonte, M. V. et al. Sustainable cow hair biocarbon-sulfur cathodes with enhanced electrochemical performance. ChemistrySelect 8, e202302443 (2023).
Yim, T. et al. Effect of chemical reactivity of polysulfide toward carbonate-based electrolyte on the electrochemical performance of Li-S batteries. Electrochim. Acta 107, 454–460 (2013).
Benítez, A. et al. Recent advances in lithium-sulfur batteries using biomass-derived carbons as sulfur host. Renew. Sustain. Energy Rev. 154, 111783 (2022).
García-Soriano, F. J. et al. Sepiolite as a novel polysulfide trapper for energy applications: an electrochemical, X-ray spectroscopic and DFT study. Phys. Chem. Chem. Phys. 25, 24761–24769 (2023).
Dominko, R. et al. Polysulfides formation in different electrolytes from the perspective of X-ray absorption spectroscopy. J. Electrochem. Soc. 165, A5014–A5019 (2018).
Prehal, C. et al. On the nanoscale structural evolution of solid discharge products in lithium-sulfur batteries using operando scattering. Nat. Commun. 13, 6326 (2022).
Rafie, A., Kim, J. W., Sarode, K. K. & Kalra, V. A review on the use of carbonate-based electrolytes in Li-S batteries: a comprehensive approach enabling solid-solid direct conversion reaction. Energy Storage Mater. 50, 197–224 (2022).
Li, L., Wang, L. & Liu, R. Effect of ether-based and carbonate-based electrolytes on the electrochemical performance of Li–S batteries. Arab. J. Sci. Eng. 44, 6361–6371 (2019).
Para, M. L. et al. Extending the conversion rate of sulfur infiltrated into microporous carbon in carbonate electrolytes. Batter. Supercaps 5, e202100374 (2022).
Atwi, R. & Rajput, N. N. Guiding maps of solvents for lithium-sulfur batteries via a computational data-driven approach. Patterns 4, 100799 (2023).
Gong, Y. et al. Towards practical application of Li–S battery with high sulfur loading and lean electrolyte: will carbon-based hosts win this race? Nano-Micro Lett. 15, 150 (2023).
Bhargav, A., He, J., Gupta, A. & Manthiram, A. Lithium-sulfur batteries: attaining the critical metrics. Joule 4, 285–291 (2020).
Nunes, R. M., Costa, D. & Ortiz, N. The use of eucalyptus activated biocarbon for water treatment-adsorption processes. Am. J. Anal. Chem. 08, 515–522 (2017).
Wiśniewska, M., Nowicki, P., Urban, T. & Gun’ko, V. M. Physicochemical and adsorption properties of nanoporous activated biocarbons from thermochemical treatment of horsetail herb. Chempluschem 89, e202302443 (2024).
Raviolo, S., Bracamonte, M. V., Calderón, C. A., Cometto, F. P. & Luque, G. L. A Green solution to energy storage: Brewers’ spent grains biocarbon–silica composites as high-performance lithium-ion batteries anodes. Energy Technol. 11, 2300342 (2023).
Gu, X. et al. Microporous bamboo biochar for lithium-sulfur batteries. Nano Res. 8, 129–139 (2015).
Wu, X. et al. Long-life lithium–sulfur battery derived from nori-based nitrogen and oxygen dual-doped 3D hierarchical biochar. ACS Appl Mater. Interfaces 9, 18889–18896 (2017).
Goktepeli, G. et al. Alternative green application areas for olive pomace catalytic pyrolysis biochar obtained via marble sludge catalyst. Biodegradation 35, 907–938 (2024).
Ayadi, M., Awad, S., Villot, A., Abderrabba, M. & Tazerout, M. Heterogeneous acid catalyst preparation from olive pomace and its use for olive pomace oil esterification. Renew. Energy 165, 1–13 (2021).
Thommes, M. et al. Physisorption of gases, with special reference to the evaluation of surface area and pore size distribution (IUPAC Technical Report). Pure Appl. Chem. 87, 1051–1069 (2015).
Dobiášová, L., Starý, V., Glogar, P. & Valvoda, V. Analysis of carbon fibers and carbon composites by asymmetric X-ray diffraction technique. Carbon37, 421–425 (1999).
Bragg, W. H., Bragg Apr, W. L., H Bragg, B. W. & Professor of Physics, C. The reflection of X-rays by crystals. Proc. R. Soc. Lond. Ser. A, Containing Pap. A Math. Phys. Character 88, 428–438 (1913).
Lascovich, J. C., Giorgi, R. & Scaglione, S. Evaluation of the sp2/sp3 ratio in amorphous carbon structure by XPS and XAES. Appl Surf. Sci. 47, 17–21 (1991).
Morgan, D. J. Comments on the XPS analysis of carbon materials. C7, 51 (2021).
Barczak, M. et al. Sulfur-tuned advanced carbons of novel properties and scalable productivity. Adv. Funct. Mater. 34, 2310398 (2024).
Helen, M. et al. Insight into sulfur confined in ultramicroporous carbon. ACS Omega 3, 11290–11299 (2018).
Senol Gungor, A. et al. Understanding rate and capacity limitations in Li-S batteries based on solid-state sulfur conversion in confinement. ACS Appl. Mater. Interfaces 16, 67651–67661 (2024).
Han, J. et al. A low cost ultra-microporous carbon scaffold with confined chain-like sulfur molecules as a superior cathode for lithium-sulfur batteries. Sustain Energy Fuels 2, 2187–2196 (2018).
Kensy, C. et al. The role of carbon electrodes pore size distribution on the formation of the cathode–electrolyte interphase in lithium–sulfur batteries. Batter. Supercaps 4, 612–622 (2021).
Su, C.-C., Wu, X., Amine, K. & Bracamonte, M. V. Probing the effectiveness in stabilizing lithium metal anodes through functional additives. ACS Appl. Mater. Interfaces 15, 59016–59024 (2023).
Rayappan, P. R., Babu, M. P., Murugan, R., Muthuraj, D. & Ramanujam, K. Confined sulfur electrode to achieve quasi-solid state sulfur conversion reaction in Li S battery. J. Energy Storage 67, 107601 (2023).
Tang, K., Yu, X., Sun, J., Li, H. & Huang, X. Kinetic analysis on LiFePO4 thin films by CV, GITT, and EIS. Electrochim. Acta 56, 4869–4875 (2011).
Dibden, J. W., Meddings, N., Owen, J. R. & Garcia-Araez, N. Quantitative galvanostatic intermittent titration technique for the analysis of a model system with applications in lithium−sulfur batteries. ChemElectroChem 5, 445–454 (2018).
Yim, T. et al. Effect of chemical reactivity of polysulfide toward carbonate-based electrolyte on the electrochemical performance of Li–S batteries. Electrochim. Acta 107, 454–460 (2013).
Florent F., Thierry H., Maria C. C., Laura M. P. & Robert D. Lithium-sulfur electrochemical cell. Patent doi:WO2021033008A1 (2021).
Acknowledgements
The authors would like to thank for the received financial support for the ALISA project (project number 9359) provided by the m-ERA.NET network (part of the European Union’s Horizon 2020 research and innovation programme (under grant agreement No 958174)), and the Slovenian Ministry of Higher Education, Science, and Innovation (MVZI) and from the Slovenian research and Innovation Agency (ARIS) under research core program P2-0423. The authors would like to thank Dr. Fernanda Stragliotto, Dr. Esteban Euti, Urban Košir, Dr. Maja Pivko and Ivana Maver for their experimental and administrative support. Dr. Bracamonte thanks Guillermo Geier from Olium for the olive residue used in this research.
Author information
Authors and Affiliations
Contributions
These authors jointly supervised this work: María Victoria Bracamonte and Alen Vizintin. F.J.G.S.: conceptualization, methodology, investigation, data curation, validation—original draft, review and editing. F.C.: conceptualization, investigation, data curation (XPS)—original draft, review, and editing. SR: Investigation, data curation (GSA)—review, and editing. E.T.: Investigation, data curation (TEM)—review, and editing. BG: Investigation, data curation (TGA)—review, and editing. T.S.: investigation, data curation (electrochemistry)—review, and editing. R.D.: funding acquisition, validation—review, and editing. M.V.B. and A.V.: visualization, investigation, funding acquisition, validation—review, and editing.
Corresponding authors
Ethics declarations
Competing interests
The authors declare no competing interests.
Peer review
Peer review information
Communications Materials thanks the anonymous reviewers for their contribution to the peer review of this work. Primary Handling Editors: Golareh Jalilvand and Jet-Sing Lee. [A peer review file is available].
Additional information
Publisher’s note Springer Nature remains neutral with regard to jurisdictional claims in published maps and institutional affiliations.
Supplementary information
Rights and permissions
Open Access This article is licensed under a Creative Commons Attribution 4.0 International License, which permits use, sharing, adaptation, distribution and reproduction in any medium or format, as long as you give appropriate credit to the original author(s) and the source, provide a link to the Creative Commons licence, and indicate if changes were made. The images or other third party material in this article are included in the article’s Creative Commons licence, unless indicated otherwise in a credit line to the material. If material is not included in the article’s Creative Commons licence and your intended use is not permitted by statutory regulation or exceeds the permitted use, you will need to obtain permission directly from the copyright holder. To view a copy of this licence, visit http://creativecommons.org/licenses/by/4.0/.
About this article

Cite this article
García-Soriano, F.J., Cometto, F., Raviolo, S. et al. Biocarbon from olive pomace residue as a sulfur host for carbonate-based lithium-sulfur batteries. Commun Mater 6, 122 (2025). https://doi.org/10.1038/s43246-025-00846-8
Received:
Accepted:
Published:
DOI: https://doi.org/10.1038/s43246-025-00846-8
