
Abstract
The Ediacaran ocean (635-541 million years ago) is typically viewed as a stagnant, redox-stratified ocean with low phosphorus availability. However, this contradicts the high total organic carbon (up to 15 wt%) recorded in the upper Ediacaran Doushantuo Formation in South China. Here, we present a quantitative reconstruction of primary productivity and sediment total organic carbon using basin-scale simulations based on various redox-nutrient scenarios. Our results indicate that oceanic upwelling was the primary driver of enhanced primary productivity, with estimates over 2.5 times the modern ocean’s average, providing quantitative evidence for oceanic circulation in the Ediacaran Nanhua Basin. Our results also indicate the development of spatially linked but opposing redox trends, i.e., a ‘redox anticouple’, whereby the expansion of the oxic surface layer occurred concurrently with intensification of deep-water anoxia due to enhanced PP in surface and its consumption of oxidants in underlying waters. This model may explain the conflicting redox records across the Nanhua Basin. Our findings explain the unusually high rates of organic matter production and preservation in the low-pO2 Ediacaran ocean and provide a mechanism for its progressive oxygenation.
Introduction
Redox reconstructions of the Ediacaran ocean (635–541 million years ago, Ma) provide crucial insights into the environmental dynamics of ancient marine ecosystems. Predominantly, these models depict the deep-ocean waters as ferruginous, characterized by high iron content and low-oxygen levels (pO2 ~ 0.1–0.25 present atmospheric level (PAL))1,2. Other geochemical proxies such as redox-sensitive trace metals (e.g., molybdenum and vanadium) and Mo and N isotopes provide evidence for, at a minimum, episodes of partial oxygenation of deep-ocean watermasses3,4,5. The prevailing view among scientists is that, during the Ediacaran to early Cambrian transition, the global deep ocean was largely anoxic with a distinctly redox-stratified water column and a variable redox boundary between the deep and shallow watermasses2,6,7. Such redox stratification suggests limited oceanic mixing, potentially pointing to a stagnant ocean. Additionally, another relevant feature of the Ediacaran Period, and the Precambrian in general, is that oceans were characterized by notably low phosphorus (P) reservoirs and bioavailability8,9,10, thus limiting primary productivity (PP. This characteristic should, in theory, limit the accumulation of organic matter (OM) in marine sediments, yet the presence of organic-rich black shales in the Doushantuo Formation’s Member IV in South China contradicts this hypothesis, suggesting a more complex interplay of geochemical processes and biological productivity in Ediacaran oceans.
Organic-rich black shales of Member IV of the Doushantuo Formation (ca. 635–551 Ma) were widely deposited across the Nanhua Basin during a late Ediacaran sea-level transgression and highstand11. These deposits exhibit exceptionally high total organic carbon (TOC) content (to 15 wt%)2,12, which marks them as invaluable geological archives of OM production and preservation during the late Ediacaran. However, the significance of Member IV black shales depends on their relationship to (i) the Neoproterozoic Oxygenation Event (NOE), the second major rise of oxygen levels in the Earth’s atmosphere and ocean13, (ii) the global Shuram Excursion14,15, the largest known negative perturbation of the carbon cycle in Earth history16 [note: Member IV records the positive shift at its termination], and (iii) early animal evolution17, offering insights into the paleonvironmental conditions that supported radiation of complex multicellular life.
The connection between these events has been a subject of considerable interest in the scientific community. Various studies have proposed enhanced PP as the driver for the oxygenation of late Ediacaran oceans18,19,20 and the recovery from the Shuram Excursion12, through an intense biological pump that increased exports of nutrients and organic carbon to seafloor sediments, leading to a 13C-enriched dissolved inorganic carbon budget, which caused positive shifts in δ13Ccarb12. These observations are supported by widespread phosphorite deposits, considered as evidence of increased nutrient availability, in the Doushantuo Fm21,22, and especially in its Member IV23,24 (Supplementary Fig. S1). However, the occurrence of phosphorite deposits in Member IV conflicts with the low P reservoirs in the Ediacaran10. Furthermore, upwelling processes have been hypothesized as the main driver of PP in the Ediacaran Nanhua Basin20,22,25 and as the key mechanism for the expansion of its oxic surface layer and intensified anoxic conditions in its deeper water column6,17. Enhanced upwelling during the Shuram Excursion is supported by high barite concentrations in a shelf-upper slope transect across the Nanhua Basin26. Consequently, it is plausible to consider that upwelling could have been a critical factor contributing to increased P availability and the extensive phosphorite deposits. Despite this, there remains a gap in the existing research, as no studies have yet provided quantitative evidence directly linking PP and upwelling processes with the exceptionally high TOC levels observed in the organic-rich shales of Doushantuo Member IV.
High TOC contents are generally due to high PP and/or enhanced organic preservation. One of the principal controls on OM preservation is the redox status of the water column. Despite efforts to reconstruct the redox conditions prevalent during the deposition of Member IV, conflicting observations have arisen, e.g., Fe speciation indicates anoxic to euxinic deep waters27,28 whereas Mo and U isotope records suggest widespread oceanic oxygenation during deposition of the black shales of Doushantuo Member IV29,30. To reconcile these conflicting redox observations, our study employs a synthesis of traditional PP equations alongside basin-scale reconstructions of multiple redox-nutrient scenarios potentially applicable to Member IV. This methodology aims to delineate the factors influencing marine productivity over time and to accurately reconstruct the paleoenvironmental conditions conducive to the generation and preservation of the large amounts of OM preserved in Member IV. By comparing the TOC values measured in rock samples against those predicted by our simulations, our study provides a coherent explanation for the anomalously high organic content of Member IV black shales, and it offers insights into oceanic circulation and mechanisms of oceanic oxygenation during the late Ediacaran, a period marked by rapid diversification of early animal life.
Simplified methodology, scenarios and dataset
The methodology used in this study integrates conventional productivity equations and computer simulations to recreate the environmental redox conditions for OM accumulation in Doushantuo Member IV, allowing model-data comparisons of laboratory measurements versus simulated TOC values. TOC analyses at geochemical laboratories strictly measure present-day TOC content, which is generally lower than original (i.e., pre-burial) sediment TOC values31. To address this uncertainty, we applied a simple calculation from ref. 32 to estimate the original TOC content. Thus, throughout the text, “TOCmc” refers to measured TOC that has been corrected for burial loss of carbon, while “TOCS” refers to the equivalent (pre-burial) TOC estimated from the computer simulations. The computer simulations were run with the software OF-Mod (Organic Facies Modelling), provided by the Norwegian SINTEF company. The methodology is divided into three steps (a methodological workflow is shown in Supplementary Fig. S2), as briefly described below, and a comprehensive description can be found in the Supplementary Methods, including parameters used, assumptions and limitations of the methodology.
The first step creates the inorganic boundary conditions of a model scenario. The software uses data from palaeobathymetric charts, sea-level curves, palaeo-coastlines, and sand fractions estimated from palaeogeographic maps, in this case, adapted from ref. 33 (Fig. 1a), to reconstruct the basin-wide distribution of linear sedimentation rates (LSR) and sediment dry bulk densities (DBD) of Member IV (see Supplementary Tables S1 and S2 for parameters and equations and Supplementary Fig. S4). The product of DBD and LSR is the bulk accumulation rate (BAR). These inorganic parameters are essential inputs of the conventional productivity equations explained in the next step.

a Map of China, with the Nanhua Basin in red, within the Yangtze Block, and reconstructed Ediacaran depositional environments with the platform-to-basin transect studied in red (X–X′). The Yangtze Block and Cathaysia Block form the South China craton. b Stratigraphic sections studied and correlation of the Doushantuo Fm. Member IV.
The second step consists of quantitative PP reconstructions of Member IV shales in six stratigraphic sections spanning a range of palaeoenvironments. In these calculations, we focused on four principal parameters (see Supplementary Table S3 for equations):
-
Primary productivity (PP), which measures the biological production of OM in the ocean.
-
Organic Carbon Flux to the sediment surface (OCFss) is defined as the OC sinking flux that reaches the sediment surface31,34.
-
Organic carbon accumulation rate (OCAR), which measures the burial flux based on the preserved quantity of TOC in the sediment31.
-
Preservation factor, calculated as OCAR/PP, represents the fraction of PP ultimately buried (and thus preserved) in the sedimentary record34.
The calculation of PP from TOC has been approached in various ways in the scientific literature, primarily through two types of methods: multivariate regression techniques making use of relationships of individual variables in large regional or global datasets (e.g., ref. 35), and techniques for TOC correction based on site-specific carbon-loss processes (e.g., refs. 36,37). The parameters used in these equations are TOC, LSR, DBD, and water depth (WD). A comprehensive evaluation is presented in ref. 38 and suggests that equations accounting for site-specific carbon-loss processes tend to offer better correspondence between measured and estimated productivity levels. Addressing these methodological uncertainties, we evaluated four different productivity equations (Supplementary Fig. S6) ultimately selecting the equation proposed by Knies and Mann37 because (i) it is a process-based equation that is expected to yield robust estimates of paleoproductivity38 (see Supplementary Methods), and (ii) it is an integral feature of the OF-Mod software and, thus, expected to yield good consistency between productivity estimates and models. To gain a clearer understanding of how variations in key parameters (e.g., TOC, LSR, DBD, and WD) affect PP, we conducted a sensitivity analysis across the four main depositional environments (see Supplementary Methods and Supplementary Fig. S7).
The final step simulates the distribution of TOC at a basinal scale. This spatial distribution is based on the interrelated aspects of PP and redox conditions during deposition and burial39. In developing these models, we utilized the software’s advanced features to simulate diverse spatial patterns of PP alongside varying redox conditions. This enabled us to effectively distinguish between areas with oxic and anoxic water columns. Additionally, we integrated PP and preservation factor values that were quantitatively determined in the previous step (see Supplementary Table S4 for parameters).
In light of the multiple redox scenarios mentioned above, the present study examined four different redox-nutrient scenarios intended to represent the environmental conditions that allowed for the production and preservation of OM. In these scenarios, TOCS values are compared to estimates based on TOCmc. The four scenarios were built using the same inorganic boundary conditions but applying different redox-nutrient conditions.
-
(1)
Anoxic scenario: non-upwelling margin with a low-oxygen atmosphere simulated with a predominantly anoxic water column having a shallow chemocline, as proposed for the Ediacaran ocean in South China by Li et al.2.
-
(2)
Oxic scenario: non-upwelling margin with a well-oxygenated atmosphere simulated with a predominantly oxygenated water column and ventilated seafloor, as proposed by refs. 40,41.
-
(3)
Anoxic + upwelling scenario: upwelling margin with a low-oxygen atmosphere simulated with additional PP contributions from nutrient-rich upwelling areas and a predominantly anoxic water column.
-
(4)
Oxic + upwelling scenario: upwelling margin with a well-oxygenated atmosphere simulated with additional PP contributions from nutrient-rich upwelling areas, leading to expansion of the oxic surface water mass and deepening of the chemocline during the Shuram Excursion, as proposed by refs. 3,5,12.
Our dataset is from the Doushantuo Formation Member IV in the Nanhua Basin, which is located in the interior of the Yangtze Block (South China Craton). We use 14 stratigraphic sections distributed across the basin. Of these, six sections are from our current study (Supplementary Data S1), while the remaining eight sections are sourced from existing literature. The geological context, along with a generalized stratigraphic chart of the Ediacaran in the upper Yangtze region and the relevant radiometric ages, are provided in the Supplementary Notes and illustrated in Fig. 1 and Supplementary Fig. S2.
Results
The facies types ranged from coastal tidal flats (WD 0 m) to deep-water settings (WD~1000 m), per the distribution illustrated in Supplementary Fig. S4a-b. After assigning a sand fraction to each facies, the resulting DBD decreases from 0.94 g cm−3 in the intrashelf to 0.81 g cm−3 in the basin (Supplementary Fig. S4c and Supplementary Table S5). Similarly, the LSR estimates obtained from modelling (see Supplementary Table S2 for the equation) decrease from 0.34 in the intrashelf to 0.03 cm kyr−1 in the basin (Supplementary Fig. S4d and Supplementary Table S5). As such, BARs vary from 0.31 g m−2 yr−1 in the intrashelf to 0.02 g m−2 yr−1 in the basin.
All parameters related to productivity exhibit consistent trends, showing an upward shift from Member III to Member IV across all examined sections, with the peak values observed mostly in the lower slope environment. Figure 2 highlights this trend, showing a rise in TOCmc from 0.5 to 18%, and PP escalating from a range of 10–102 to 102–103 gC m−2 yr−1, with the lower slope areas peaking at ~1700 gC m−2 yr−1. The OCFss rose from <10 gC m−2 yr−1 in Member III to nearly 103 gC m−2 yr−1 in Member IV. Similarly, the OCAR increased from 10−3 gC m−2 yr−1 in Member III to 1 gC m−2 yr−1, with the intrashelf areas yielding the highest values. Additionally, the preservation factor, reported as a dimensionless fractional value, remained relatively low, ranging from 10−4 to 10−5. The full dataset is presented in Supplementary Data S1, and the mean values and standard deviations (1sd) of these parameters are given in Supplementary Table S5.

a Carbonate carbon isotopes representing the Shuram Excursion and its recovery along Member IV to positive values. Black line represents the recovery from the Shuram Excursion to positive values. Cross symbols are from ref. 27 and dots are from ref. 12. Colours refer to the different paleoenvironments. b Measured and corrected TOC values (TOCmc). c Primary productivity (PP) calculated with the ref. 37 equation. d Organic carbon flux to the sediment surface (OCFss). e Organic carbon accumulation rate (OCAR). Vertical dashed line in (a) shows the standard Peedee belemnite value. The salmon-coloured area in (c) represents the global range of long-term primary productivity in the modern ocean from ref. 53. Intrashelf sections: Xiangerwan, Zhimaping, and Qinglinkou. Upper slope section: Taoying. Lower slope section: Xiajiaomeng. Basin section: Fengtan.
Across the 14 study sections, TOCmc displays variations, with average values of 4.9 ± 1.8% in intrashelf areas, 5.4 ± 0.3% in upper slope areas, 12.5 ± 1.8% in lower slope areas, and 4.7 ± 0.3% in basinal areas (see Supplementary Fig. S5 and Supplementary Table S5). Simulated TOC differs across the four redox-nutrient scenarios. In the anoxic scenario, there is an insignificant correlation between TOCS and TOCmc (R2 = 0.03; p = 0.55; note: only p ≤ 0.05 is considered significant), with the highest TOCS values around 3% in the upper slope area. The oxic scenario shows a weak TOCS–TOCmc correlation (R2 = 0.30, p = 0.043), with peak TOCS values of ~1.5% in the intrashelf and ~2.0% in the basin. The anoxic + upwelling scenario exhibits a non-significant correlation (R2 = 0.09, p = 0.29), with similar values for TOCmc and TOCS in the intrashelf and upper slope but significant disparities in the lower slope and basin (3–4% versus 12.5%). Notably, the oxic + upwelling scenario yields a strong TOCS–TOCmc correlation (R2 = 0.80, p = 0.001), especially in the lower slope area where TOCS is 11.3 ± 1.5% compared to TOCmc of 12.5 ± 1.8%.
Discussion
Inorganic influence on organic carbon accumulation and preservation
Burial of OM is a key process in the Earth’s carbon cycle contributing to the oxygenation of the atmosphere. This occurs because organic carbon burial in sediments prevents it from re-entering the atmosphere as carbon dioxide (CO2) through decomposition, preventing the consumption of oxygen by aerobic decomposers. The most important parameters that influence the burial of OM in marine sediment are LSR, redox conditions, and the flux of OM to the seafloor42.
The relationship between LSR and OC has been treated by multiple studies31,36,43,44, which provided robust relationships for LSR→OCAR transfer functions. One of the key factors impacting our PP and OCAR calculations is the lack of a measurable dilution effect in sediments, which refers to the addition of an inorganic fraction that reduces the OC concentration of the sediment39. The extremely low sedimentation rates, between 0.34 and 0.03 cm kyr−1, rule out dilution effects meaning that OM preservation was not affected by the input of an inorganic fraction. This is because dilution typically has an effect only when LSR exceeds ~10 cm kyr−1, i.e., the rate at which the main effect of siliciclastic accumulation shifts from prevention of OM oxidation (i.e., OM preservation) to dilution of OM (due to no further increase in OM preservation)42.
The low LSRs observed in Member IV can be explained by the tectonic setting of the study area. The Nanhua Basin is an intracratonic rift basin in the interior of the Yangtze Block (South China Craton45). Intracratonic basins are formed within the stable interiors of continents, representing regions of low tectonic activity and long-term stability, leading to slow subsidence over long periods. As a consequence, intracratonic basins display unique sedimentation patterns compared to basins located at tectonically active margins. The low LSRs observed in Member IV are comparable to those of other Neoarchean and Paleoproterozoic basins46 and are attributable to the intracratonic basinal setting of the Doushantuo Formation and its deposition during a prolonged interval of sea-level transgression and highstand11.
A comparison of our samples with modern BAR and OCAR (n∼4000) compiled by Schoepfer et al.36 shows that the highest OCARs are found in anoxic settings, correlating with high TOC content (Fig. 3a). Our results show a robust positive correlation between BAR and OCAR (R2 = +0.913) as observed generally in sedimentary systems31,44. Interestingly, our findings are within the 1–10% OC range, aligning with sediment deposition in suboxic to anoxic conditions47. However, our samples plot in the range of BARs-OCARs associated with oxic settings in the modern ocean, partly attributable to the exceptionally low LSRs of Member IV. It is important to note, however, that the BAR-OCAR compilation by Schoepfer et al.36 does not include any intracratonic basinal data, rendering a comparison with the Nanhua Basin uncertain.

a Bulk accumulation rates (BAR) versus organic carbon accumulation rates (OCAR) for the studied samples. Modern ocean data compiled by Schoepfer et al.36. Dashed lines represent the % of OC present in the sediment47. b Averaged BAR versus organic carbon preservation factor. (L95) dataset is based on satellite chlorophyll measurements, and the Oregon State (OS) dataset is based on in situ measurements using the 14C uptake method integrated over the depth of the photic zone and averaged by L95 oceanic province36. The preservation factor is dimensionless.
Preservation factor values, ranging from 10−3 to 10−5 for Member IV, are plotted on a BAR-Preservation factor plot (Fig. 3b) with a similar slope to the modern ocean dataset from ref. 38 but shifted towards higher preservation at lower sedimentation rates, which may serve as an indicator of anoxic conditions in deep basinal settings. Globally, most marine OM is remineralized to its inorganic constituents such that only 0.1–0.5% of primary productivity is preserved in the sediment48. Thus, the exceptionally high preserved TOC values in Member IV, averaging between 3.2% and 12.8%, in combination with a low preservation factor, suggest that primary productivity operated at rates large enough to yield high TOC values, consistent with our calculated PP values of up to 1700 gC m−2 yr−1.
Quantitative evidence for upwelling-driven high PP in late Ediacaran ocean
The two additional critical factors affecting the burial of OM in marine sediments are the rate of production of OM and the marine redox conditions favouring its preservation during deposition. In this context, we have analyzed the results of TOCmc versus TOCS for four distinct redox scenarios, derived from various combinations of redox-nutrient conditions:
-
(1)
Anoxic scenario (Fig. 4a): this scenario is characterized by a low-oxygen atmosphere (~0.1% PAL)49, predominantly anoxic waters, and a non-upwelling margin. In this scenario, the chemocline position is high, and PP is limited mainly to shallow-shelf areas, yielding TOCS up to 3%. However, this model also yields a spatial distribution of TOCS values opposite to that of TOCmc—specifically, TOCS values peak in intrashelf areas near shallow high-productivity zones, whereas TOCmc is higher (to 12.5 ± 1.8%) in the basin. This is represented by the absence of a correlation between TOCmc and TOCS (R2 = 0.03, p = 0.55). In this scenario, anoxic conditions likely favoured the preservation of OM once deposited. However, PP was mainly limited to shallow-shelf areas. This factor may explain why higher TOCmc values (up to 3%) are found in intrashelf areas, where the influence of both nearshore PP and oxic surface layer effects converge, and where higher BARs would have facilitated the preservation of OM. Conversely, lower TOCmc values (∼2%) are found in the basin, where limited PP comes from the thin oxic surface layer, and where the inorganic parameters are characterized by lower BARs relative to the intrashelf area. There, the TOCS and TOCmc differ by more than 10%.
Fig. 4: Results for the oxic and anoxic environmental models. 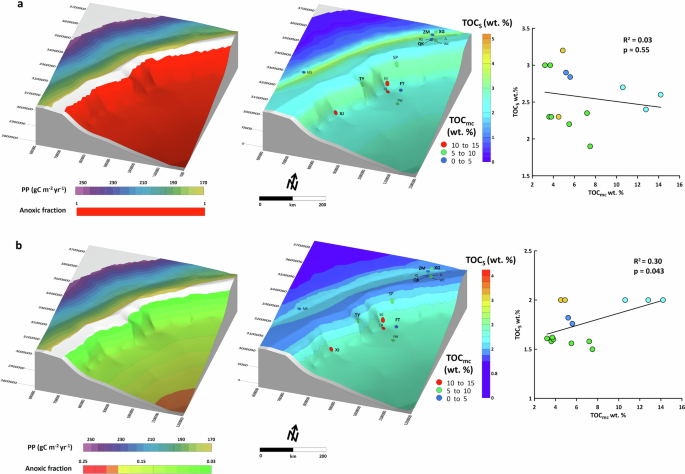
a Represents an anoxic scenario illustrating a non-upwelling margin under a low-oxygen atmosphere. b Represents an oxic scenario characterized by a non-upwelling margin within a well-oxygenated atmosphere. In (a) and (b), the left map displays the distribution of primary productivity (PP) and the anoxic fraction across the basin, the centre map shows the TOCS based on the interplay between PP and redox conditions and the plot on the right shows the correlation between TOCmc and TOCS values. TOC simulated TOC; TOCmc measured and corrected TOC. Sections are from this study (bold) and the literature. XG Xiangerwan, JL Jiulongwan, ZM Zhimaping, QK Qinglinkou, WC Wuhe core, JQ Jiuqunao, MS Maoshi, TY Taoying, SP Siduping, SG Songtao, XJ Xiajiaomeng, LB Longbizui, FT Fengtan, YW Yanwutan. The coloured circles overlaying this map correspond to the average TOCmc values from Member IV organic-rich samples, as compiled in Supplementary Fig. S5.
-
(2)
Oxic scenario (Fig. 4b): this scenario is characterized by a relatively oxygenated atmosphere (~10% PAL)49, predominantly oxic waters, and a non-upwelling margin. In this scenario, TOCS consistently averages ∼2% across the basin, though slightly elevated values are observed in the basin centre. This pattern starkly contrasts with the peak TOCmc of 12.5 ± 1.8% identified in the basin area, resulting in a weak correlation (R2 = 0.30, p = 0.043). PP was mainly limited to shallow-shelf areas, and OM likely experienced enhanced remineralization during its descent to the seafloor through oxic waters. Moreover, oxygenated shallow facies for Member IV are based on Fe speciation, S isotopes, and U and Mo concentration and isotope data29,30. However, these studies did not identify a potential source of oxygen. One possibility could be bacterial sulfate reduction coupled with pyrite burial50, which releases on a mole-for-mole basis almost twice as much O2 as organic carbon burial51. However, the consensus is that the oxygen released through pyrite burial is roughly offset by the oxygen consumed during pyrite weathering50. Thus, even if pyrite burial contributed to the late Ediacaran O2 production, this mechanism does not explain alone the amount of oxygen produced.
In our simulation, we introduced two additional models that feature a nutrient-enriched zone of high productivity along the upper slope—this area benefits from the upwelling of nutrients that boost PP. Despite suggestions of a limited phosphorus (P) reservoir in the predominantly anoxic Ediacaran oceans9, recent studies of P cycling during the Shuram Excursion indicate two notable periods of global high P concentrations, with seawater P levels increasing from ~2 to ~4–5 µM10. Our study aligns with the timing of the second such episode, implying that the increased availability of phosphorus in seawater could have enhanced PP. This hypothesis is further supported by the discovery of widespread phosphorite deposits within Member IV23,24, suggesting a broader environmental impact of these elevated phosphorus levels.
-
(3)
Anoxic + upwelling scenario (Fig. 5a): this scenario is characterized by a low-oxygen atmosphere (~0.1% PAL)49, predominantly anoxic waters, and an upwelling margin. In this scenario, the introduction of an additional zone of PP predominantly influences shallow environments, achieving comparable TOCS and TOCmc values. For instance, in the intrashelf area, TOCS values are around 3 ± 2%, aligning more closely with the TOCmc of 4.9 ± 1.8% for the same area. A similar trend is observed in the upper slope, where TOCS of 5.0 ± 1.0% closely matches TOCmc values of 5.4 ± 0.3%. Conversely, TOCS values in deeper environments remain stable ~3–4%, markedly lower than the corresponding TOCmc leading to a very weak correlation (R2 = 0.09, p = 0.29). This pattern suggests that the upwelling processes might not have been robust enough to substantially boost PP or to sufficiently oxygenate the water column. As a result, the model predicts anoxic conditions and reduced TOCS levels in the basin. Although anoxic conditions generally favour the preservation of OM, the relatively mild upwelling likely did not elevate PP to levels that would match the observed TOCmc values.
Fig. 5: Results for the oxic and anoxic environmental models introducing upwelling processes. 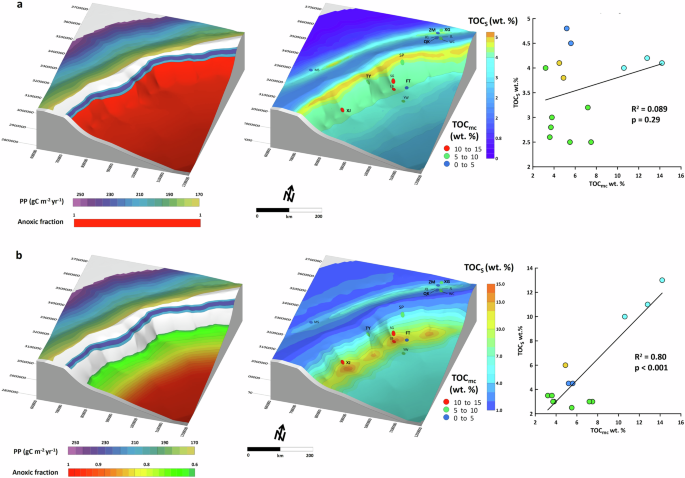
a Represents an anoxic + upwelling scenario illustrating an upwelling margin under a low-oxygen atmosphere. b Represents an oxic + upwelling scenario characterized by an upwelling margin within a well-oxygenated atmosphere. In (a) and (b), the left map displays the distribution of primary productivity (PP) and the anoxic fraction across the basin, the centre map shows the TOCS based on the interplay between PP and redox conditions and the plot on the right shows the correlation between TOCmc and TOCS values. TOCS simulated TOC, TOCmc measured and corrected TOC. Sections are from this study (bold) and the literature. XG Xiangerwan, JL Jiulongwan, ZM Zhimaping, QK Qinglinkou, WC Wuhe core, JQ Jiuqunao, MS Maoshi, TY Taoying, SP Siduping, SG Songtao, XJ Xiajiaomeng, LB Longbizui, FT Fengtan, YW Yanwutan. The coloured circles overlaying this map correspond to the average TOCmc values from Member IV organic-rich samples, as compiled in Supplementary Fig. S5.
-
(4)
Oxic + upwelling scenario (Fig. 5b): this scenario is characterized by a relatively oxygenated atmosphere (~10% PAL)49, transitional oxic–anoxic waters, and an upwelling margin. In this scenario, the highest TOCS values (~11.3 ± 1.5%) are found directly beneath the upwelling zone, concurring with TOCmc values of 12.5 ± 1.8% for the lower slope area. This model demonstrates an excellent correlation between TOCS and TOCmc values, particularly in the lower slope region. Additionally, the results from the upper slope area also show a strong match, with TOCS values of 4.5% closely aligning with TOCmc values of 5.4%. These findings lead to a very strong correlation (R2 = 0.80, p = 0.001), underscoring the model’s effectiveness in replicating observed TOC distributions. Elevated PP and OM sinking flux typically result in higher O2 consumption in the deep-water column and a stronger tendency towards the development of anoxia. Accordingly, this scenario envisions a vertical gradient of oxygenation of the water column, initiated from the mid-slope area and intensifying towards the basin, driven by an active biological pump. This is modelled as an anoxic gradient ranging from 1 (anoxic) to 0 (oxic). However, it is important to highlight that the oxygenation of the water column by this mechanism was likely a complex and multifaceted process involving both vertical and lateral variation. Therefore, considering the basin-scale perspective of this study, a lateral redox gradient has also been integrated into the analysis. An outlier in this context is the Fengtan section (not included in the TOC correlation), which exhibits notably lower TOCmc values compared to TOCS values (4.5% versus ~10%). Several explanations could account for this discrepancy. It is conceivable that only a restricted area beneath the upper slope received substantial OM, which avoided remineralization; however, if this were the case, similar phenomena should be observable in other basin-margin sections like Yanwutan or Longbizui, yet they are not. Alternatively, Fengtan’s notably low BAR (0.04 g m−2 yr−1) might explain the diminished TOCmc, as lower rates could hinder OM preservation. Jarvie32 found that LSR does have a pronounced effect on TOC preservation, even in anoxic settings. Moreover, the notably low LSR imply that OM at the sediment–water interface could be exposed to even a small flux of oxygen over a long period. However, if this were the case, we would expect to observe analogous patterns across other deep sections as well. Nonetheless, the mismatch between TOCS and TOCmc could signify spatial heterogeneity in the oxygenation of the Ediacaran Nanhua Basin, impacting specific areas of the basin floor.


Our models show that the best fit of the simulated versus measured-corrected TOC, the oxic + upwelling scenario, requires a nutrient-rich upwelling-driven process. The tropical ___location of the Yangtze Craton, positioned between 20° and 30° N during the period from 580 to 530 Ma52, likely played a crucial role in connecting upwelling with wind-driven Ekman transport. This process is similar to modern wind-driven upwelling systems, which predominantly occur in tropical and subtropical regions. The remarkable increase in PP, yielding values 2.5 times (Fig. 2c) over average modern PP rates53, aligns with findings from the Ediacaran–Cambrian transition in South China, providing a comparative framework for our results54,55. Collectively, these results suggest that the late Ediacaran environment was characterized by initially low PP rates (10–100 gC m−2 yr−1) in Member III, with an abrupt increase in palaeoproductivity and organic carbon burial around the Member III–Member IV boundary to peak values up to 1700 gC m−2 yr−1 in Member IV. High PP rates were sustained through Member IV and possibly also into the overlying upper Ediacaran Dengying Fm. Thereafter, PP values fell to ∼1000 gC m−2 yr−1 in Cambrian Stage 2 (~526 Ma)55 and then decreased further to near-modern values (10–200 gC m−2 yr−1) by ∼518 Ma54. Therefore, our findings offer compelling quantitative evidence of an extraordinary increase in organic productivity in the late Ediacaran, with peak production reached during the deposition of Member IV of the Doushantuo Formation.
Previous studies have hypothesized the existence of upwelling in the Ediacaran Nanhua Basin20,22,56,57. Indeed, refs. 15,58 suggest this mechanism was crucial for the expansion of oxic surface waters and the deepening of anoxic conditions in the water column. However, although upwelling was likely a major reason for increased nutrient availability during the deposition of Member IV based on our modelling results, nutrient fluxes from continental weathering cannot be excluded. Recent studies10 suggest that elevated continental weathering during the first part of the Shuram Excursion, supported by increased 87Sr/86Sr10,59, accelerated P cycling via release of P during oxidation of a large dissolved organic carbon (DOC) pool60, and the concurrent CO2 release further increased the weathering flux of P to the ocean10. During the last stage of the Shuram Excursion, which corresponds to Doushantuo Member IV, continental weathering decreased10,59. However, the accumulated P reservoir from the first part of the Shuram Excursion continued to play a major role via upwelling for the high organic production and TOC content of Member IV10. Also supporting the upwelling hypothesis, recent studies in upper slope areas document extensive early diagenetic and authigenic barite formation linked to upwelling-driven productivity during the Ediacaran26, mostly occurring during the recovery part of the Shuram Excursion, as well as during the Late Ordovician–Early Silurian61. Building on these insights, we conclude that our simulations of multiple redox-nutrient scenarios and quantitative paleoproductivity estimates offer a quantitative and comprehensive evaluation of the environmental conditions during the deposition of Doushantuo Member IV.
Implications for a redox anticouple in the late Ediacaran Ocean
A comparison of the four redox scenarios of the present study shows that the best match between TOCS and TOCmc is obtained in the oxic + upwelling model. However, unlike in modern oceans that experience upwelling-driven oxygen minimum zone development, which is spatially constrained and surrounded by oxic waters, the dissolved oxygen levels in Ediacaran oceans may have been modulated by an unusual mechanism, at least locally. We suggest that, during this period, a pronounced redox anticouple (i.e., synchronous but opposite redox changes in shallow and deep environments) developed in oceanic areas subject to intense upwelling. Heightened PP and oxygen production due to upwelled nutrients caused the ocean-surface layer to become more oxidizing, gradually forcing the chemocline downward in the ocean. At the same time, increased PP led to a greater sinking flux of OM (i.e., intensified biological pump) that depleted deeper oceanic watermasses of oxidants, including dissolved oxygen, sulfate, and nitrate, causing a shift towards more intensely reducing conditions.
A combination of upwelling-driven surface nutrient supply and P regeneration in the deeper waters is likely to have created a positive feedback loop for PP47. This may have been the case for the Nanhua Basin, with the upwelling process also advecting deep-water DOC that, after being oxidized at the redoxcline, released a large amount of P10 that served to sustain PP in surface waters. On the other hand, under conditions of intensified deep-water anoxia, the recycling of P from the sediment back into the water column was likely particularly intense due to the rapid reduction of P-bearing Fe-(oxyhydr)oxides and the preferential release of P from decaying OM during sulfate reduction47. This boost in PP led to higher OM production and burial levels and enhanced release of O2, which ultimately supported organisms with higher aerobic requirements and fostered marine ecosystem diversity. Thus, the development of opposing redox trends in shallow versus deep oceanic waters may be a key to understanding (i) the conflicting redox interpretations based on multiple geochemical proxies, and (ii) unusually high levels of OM preservation as well as early oceanic oxygenation mechanisms and their relationship to early animal radiation.
Conclusions
This study simulated the distribution of TOC content in organic-rich shales of Member IV of the upper Ediacaran Doushantuo Formation along a platform-to-basin transect in the Nanhua Basin using multiple redox-nutrient scenarios. Calculations of palaeoproductivity rates in Member IV indicating ~2.5 times greater than those in the modern ocean, suggest that this period was marked by exceptionally high PP. Among the various redox-nutrient scenarios simulated, the oxic + upwelling scenario aligns most closely with actual observations, demonstrating a strong correlation (R2 = 0.80, p = 0.001) between simulated and measured TOC values, and thus more accurately reflects the paleoenvironmental conditions that were likely present during the deposition of Member IV. This finding offers, to the best of our knowledge, the first quantitative evidence for upwelling processes and, thus, intense oceanic circulation in the Ediacaran Nanhua Basin. Upwelling processes likely led to self-sustained primary productivity and intensification of the biological pump, producing the expansion of the oxic ocean-surface layer and concurrent intensification of deep-water anoxia, representing a “redox anticouple”, reconciling conflicting redox records observed from different proxies across the basin. This pattern of redox evolution may have been responsible for unusually high rates of OM production and preservation during the recovery from the largest negative δ13Ccarb excursion in Earth history (i.e., the late Ediacaran Shuram Excursion), providing a plausible mechanism of oceanic oxygenation and its relationship to early animal radiation. Our study highlights the value of an integrated modelling approach to investigating the productivity-redox dynamics of ancient depositional systems.
Data availability
All data generated or analyzed during this study are available in the published article (and its Supplementary Information files).
References
Canfield, D. E., Poulton, S. W. & Narbonne, G. M. Late-Neoproterozoic deep-ocean oxygenation and the rise of animal life. Science. 315, 92–95 (2007).
Li, C. et al. A stratified redox model for the Ediacaran ocean. Science. 328, 80–83 (2010).
Sahoo, S. K. et al. Ocean oxygenation in the wake of the Marinoan glaciation. Nature 489, 546–549 (2012).
Chen, X. et al. Rise to modern levels of ocean oxygenation coincided with the Cambrian radiation of animals. Nat. Commun. 6, 1–7 (2015).
Wang, W. et al. Integrated carbon, sulfur, and nitrogen isotope chemostratigraphy of the Ediacaran Lantian Formation in South China: spatial gradient, ocean redox oscillation, and fossil distribution. Geobiology 15, 552–571 (2017).
Li, C., Shi, W., Cheng, M., Jin, C. & Algeo, T. J. The redox structure of Ediacaran and early Cambrian oceans and its controls. Sci. Bull. 65, 2141–2149 (2020).
Huang, J. et al. A predominantly ferruginous condition in the Ediacaran deep ocean: geochemistry of black shales in the Ediacaran Doushantuo Formation, South China. Precambrian Res. 295, 12–23 (2017).
Reinhard, C. T. et al. Evolution of the global phosphorus cycle. Nature 541, 386–389 (2017).
Guilbaud, R. et al. Phosphorus-limited conditions in the early Neoproterozoic ocean maintained low levels of atmospheric oxygen. Nat. Geosci. 13, 296–301 (2020).
Dodd, M. S. et al. Uncovering the Ediacaran phosphorus cycle. Nature 618, 974–980 (2023).
Vernhet, E. Paleobathymetric influence on the development of the late Ediacaran Yangtze platform (Hubei, Hunan, and Guizhou provinces, China). Sediment. Geol. 197, 29–46 (2007).
Cañadas, F., Papineau, D., Leng, M. J. & Li, C. Extensive primary production promoted the recovery of the Ediacaran Shuram excursion. Nat. Commun. 13, 1–9 (2022).
Och, L. M. & Shields-Zhou, G. A. The Neoproterozoic oxygenation event: environmental perturbations and biogeochemical cycling. Earth Sci. Rev. 110, 26–57 (2012).
Zhu, M. et al. Carbon isotope chemostratigraphy and sedimentary facies evolution of the Ediacaran Doushantuo Formation in western Hubei, South China. Precambrian Res. 225, 7–28 (2013).
Li, C. et al. Uncovering the spatial heterogeneity of Ediacaran carbon cycling. Geobiology 15, 211–224 (2017).
Grotzinger, J. P., Fike, D. A. & Fischer, W. W. Enigmatic origin of the largest-known carbon isotope excursion in Earth’s history. Nat. Geosci. 4, 285–292 (2011).
Narbonne, G. M. The Ediacara biota: Neoproterozoic origin of animals and their ecosystems. Annu. Rev. Earth Planet. Sci. 33, 421–442 (2005).
She, Z., Strother, P. & Papineau, D. Terminal Proterozoic cyanobacterial blooms and phosphogenesis documented by the Doushantuo granular phosphorites II: Microbial diversity and C isotopes. Precambrian Res. 251, 62–79 (2014).
Tahata, M. et al. Carbon and oxygen isotope chemostratigraphies of the Yangtze platform, South China: decoding temperature and environmental changes through the Ediacaran. Gondwana Res. 23, 333–353 (2013).
Ader, M. et al. Ocean redox structure across the Late Neoproterozoic Oxygenation Event: a nitrogen isotope perspective. Earth Planet. Sci. Lett. 396, 1–13 (2014).
Cui, H. et al. Phosphogenesis associated with the Shuram Excursion: Petrographic and geochemical observations from the Ediacaran Doushantuo Formation of South China. Sediment. Geol. 341, 134–146 (2016).
Gao, Y., Zhang, X., Zhang, G., Chen, K. & Shen, Y. Ediacaran negative C-isotopic excursions associated with phosphogenic events: evidence from South China. Precambrian Res. 307, 218–228 (2018).
Xiao, S. et al. Integrated chemostratigraphy of the Doushantuo Formation at the northern Xiaofenghe section (Yangtze Gorges, South China) and its implication for Ediacaran stratigraphic correlation and ocean redox models. Precambrian Res. 192, 125–141 (2012).
Cui, H. et al. Redox architecture of an Ediacaran ocean margin: integrated chemostratigraphic (δ13C-δ34S-87Sr/86Sr-Ce/Ce*) correlation of the Doushantuo Formation, South China. Chem. Geol. 405, 48–62 (2015).
Och, L. M. et al. Palaeoceanographic controls on spatial redox distribution over the Yangtze Platform during the Ediacaran–Cambrian transition. Sedimentology 63, 378–410 (2016).
Cheng, M. et al. Barite in the Ediacaran Doushantuo Formation and its implications for marine carbon cycling during the largest negative carbon isotope excursion in Earth’s history. Precambrian Res. 368, 106485 (2022).
McFadden, K. A. et al. Pulsed oxidation and biological evolution in the Ediacaran Doushantuo Formation. Proc. Natl. Acad. Sci. USA 105, 3197–3202 (2008).
Wang, L., Shi, X. & Jiang, G. Pyrite morphology and redox fluctuations recorded in the Ediacaran Doushantuo Formation. Palaeogeogr. Palaeoclimatol. Palaeoecol. 333–334, 218–227 (2012).
Ostrander, C. M. et al. Multiple negative molybdenum isotope excursions in the Doushantuo Formation (South China) fingerprint complex redox-related processes in the Ediacaran Nanhua Basin. Geochim. Cosmochim. Acta 261, 191–209 (2019).
Sahoo, S. K. et al. Oceanic oxygenation events in the anoxic Ediacaran ocean. Geobiology 14, 457–468 (2016).
Algeo, T. J. et al. Plankton and productivity during the Permian-Triassic boundary crisis: an analysis of organic carbon fluxes. Glob. Planet. Change 105, 52–67 (2013).
Jarvie, D. M. Total organic carbon (TOC) analysis. In Handbook of Petroleum Geology, Source and Migration Processes and Evaluation Techniques (ed. Merrill, R. K.) 113–118 (AAPG, Treatise of Petroleum Geology, 1991).
Jiang, G., Shi, X., Zhang, S., Wang, Y. & Xiao, S. Stratigraphy and paleogeography of the Ediacaran Doushantuo Formation (ca. 635–551 Ma) in South China. Gondwana Res. 19, 831–849 (2011).
Betzer, P. R. et al. Primary productivity and particle fluxes on a transect of the equator at 153°W in the Pacific Ocean. Deep Sea Res. A Oceanogr. Res. Pap. 31, 1–11 (1984).
Müller, P. J. & Suess, E. Productivity, sedimentation rate, and sedimentary organic matter in the oceans-I. Organic carbon preservation. Deep Sea Res. A Oceanogr. Res. Pap. 26, 1347–1362 (1979).
Schoepfer, S. D. et al. Total organic carbon, organic phosphorus, and biogenic barium fluxes as proxies for paleomarine productivity. Earth Sci. Rev. 149, 23–52 (2015).
Knies, J., Mann, U., Popp, B. N., Stein, R. & Brumsack, H. J. Surface water productivity and paleoceanographic implications in the Cenozoic Arctic Ocean. Paleoceanography 23, 1–12 (2008).
Felix, M. A comparison of equations commonly used to calculate organic carbon content and marine palaeoproductivity from sediment data. Mar. Geol. 347, 1–11 (2014).
Knies, J. & Mann, U. Depositional environment and source rock potential of Miocene strata from the central Fram Strait: introduction of a new computing tool for simulating organic facies variations. Mar. Pet. Geol. 19, 811–828 (2002).
Wang, H. et al. Sulfate triple-oxygen-isotope evidence confirming oceanic oxygenation 570 million years ago. Nat. Commun. 14, 1–9 (2023).
Kendall, B. et al. Uranium and molybdenum isotope evidence for an episode of widespread ocean oxygenation during the late Ediacaran Period. Geochim. Cosmochim. Acta 156, 173–193 (2015).
Betts, J. N. & Holland, H. D. The oxygen content of ocean bottom waters, the burial efficiency of organic carbon, and the regulation of atmospheric oxygen. Palaeogeogr. Palaeoclimatol. Palaeoecol. 97, 5–18 (1991).
Canfield, D. E. Factors influencing organic-carbon preservation in marine sediments. Chem. Geol. 114, 315–329 (1994).
Tyson, R. V. The “productivity versus preservation” controversy: cause, flaws, and resolution. SEPM 82, 17–33 (2005).
Yang, F., Zhou, X., Peng, Y., Song, B. & Kou, X. Evolution of Neoproterozoic basins within the Yangtze Craton and its significance for oil and gas exploration in South China: an overview. Precambrian Res. 337, 105563 (2020).
Altermann, W. & Nelson, D. R. Sedimentation rates, basin analysis and regional correlations of three Neoarchaean and Palaeoproterozoic sub-basins of the Kaapvaal Craton as inferred from precise U-Pb zircon ages from volcaniclastic sediments. Sediment. Geol. 120, 225–256 (1998).
Ingall, E. & Jahnke, R. Influence of water-column anoxia on the elemental fractionation of carbon and phosphorus during sediment diagenesis. Mar. Geol. 139, 219–229 (1997).
De La Rocha, C. L. In Treatise on Geochemistry (eds Holland, H. D. & Turekian, K. K.) 1–29 (Pergamon, 2007).
Krause, A. J., Mills, B. J. W., Merdith, A. S., Lenton, T. M. & Poulton, S. W. Extreme variability in atmospheric oxygen levels in the late Precambrian. Sci. Adv. 8, eabm8191 (2022).
Shields, G. A. et al. Unique Neoproterozoic carbon isotope excursions sustained by coupled evaporite dissolution and pyrite burial. Nat. Geosci. 12, 823–827 (2019).
Garrels, R. M. & Lerman, A. Coupling of the sedimentary sulfur and carbon cycles - an improved model. Am. J. Sci. 284, 989–1007 (1984).
Zhao, G. et al. Geological reconstructions of the East Asian blocks: from the breakup of Rodinia to the assembly of Pangea. Earth Sci. Rev. 186, 262–286 (2018).
Longhurst, A., Sathyendranath, S., Platt, T. & Caverhill, C. An estimate of global primary production in the ocean from satellite radiometer data. J. Plankton Res. 17, 1245–1271 (1995).
Xiang, L., Schoepfer, S. D., Zhang, H., Cao, C. Q. & Shen, S. Z. Evolution of primary producers and productivity across the Ediacaran-Cambrian transition. Precambrian Res. 313, 68–77 (2018).
Jin, C. et al. Controls on organic matter accumulation on the early-Cambrian western Yangtze Platform, South China. Mar. Pet. Geol. 111, 75–87 (2019).
Cao, M. et al. Comparison of Ediacaran platform and slope δ238U records in South China: implications for global-ocean oxygenation and the origin of the Shuram Excursion. Geochim. Cosmochim. Acta 287, 111–124 (2020).
Gao, Y. et al. High primary productivity during the Ediacaran Period revealed by the covariation of paired C-isotopic records from South China. Precambrian Res. https://doi.org/10.1016/j.precamres.2019.105411 (2019)
Li, C. et al. Ediacaran marine redox heterogeneity and early animal ecosystems. Sci. Rep. 5, 17097 (2015).
Sawaki, Y. et al. The Ediacaran radiogenic Sr isotope excursion in the Doushantuo Formation in the three Gorges area, South China. Precambrian Res. 176, 46–64 (2010).
Rothman, D. H., Hayes, J. M. & Summons, R. E. Dynamics of the Neoproterozoic carbon cycle. Proc. Natl. Acad. Sci. USA 100, 8124–8129 (2003).
Zhao, S. Z. et al. Development of upwelling during the sedimentary period of the organic-rich shales in the Wufeng and Longmaxi formations of the upper Yangtze region and its impact on organic matter enrichment. J. Mar. Sci. Eng. 7, 1–17 (2019).
Acknowledgements
We thank SINTEF company for providing access to the OF-Mod software, especially Gerben de Jager and Ane Lothe, for their technical support. F.C. acknowledges support from NERC for a DTP scholarship (NE/L002485/1). C.L. acknowledges support from the National Key Research and Development Program of China (2022YFF0800100) and the NSFC (42130208 and 42425002).
Author information
Authors and Affiliations
Contributions
Conceptualization: F.C., C.L.; methodology: F.C.; supervision: F.C., D.P.; writing—original draft: F.C.; writing—review & editing: F.C., D.P., T.A., C.L.
Corresponding authors
Ethics declarations
Competing interests
The authors declare no competing interests.
Peer review
Peer review information
Communications Earth & Environment thanks Julia Horne, Yinggang Zhang, and Benjamin Johnson for their contribution to the peer review of this work. Primary Handling Editors: Mojtaba Fakhraee and Carolina Ortiz Guerrero. A peer review file is available.
Additional information
Publisher’s note Springer Nature remains neutral with regard to jurisdictional claims in published maps and institutional affiliations.
Rights and permissions
Open Access This article is licensed under a Creative Commons Attribution 4.0 International License, which permits use, sharing, adaptation, distribution and reproduction in any medium or format, as long as you give appropriate credit to the original author(s) and the source, provide a link to the Creative Commons licence, and indicate if changes were made. The images or other third party material in this article are included in the article’s Creative Commons licence, unless indicated otherwise in a credit line to the material. If material is not included in the article’s Creative Commons licence and your intended use is not permitted by statutory regulation or exceeds the permitted use, you will need to obtain permission directly from the copyright holder. To view a copy of this licence, visit http://creativecommons.org/licenses/by/4.0/.
About this article

Cite this article
Cañadas, F., Papineau, D., Algeo, T.J. et al. Upwelling-driven high organic production in the late Ediacaran. Commun Earth Environ 5, 461 (2024). https://doi.org/10.1038/s43247-024-01632-z
Received:
Accepted:
Published:
DOI: https://doi.org/10.1038/s43247-024-01632-z
